Figures & data
Figure 1. Identification of m6A-modified DEGs between ccRCC tissues and normal tissues. A The volcano plot visualizes the DEGs in GSE66272. Green dots represent downregulated genes and red dots represent upregulated genes. FC, Fold Change. Adj.P.Val, adjust P value. B The Venn plot of m6A-modified DEGs in ccRCC. C The mRNA levels of m6A-modified DEGs in both ccRCC tissues and adjacent normal tissues from GSE66272. D-E GO (d) and KEGG (e) pathway analysis of m6A-modified DEGs in ccRCC
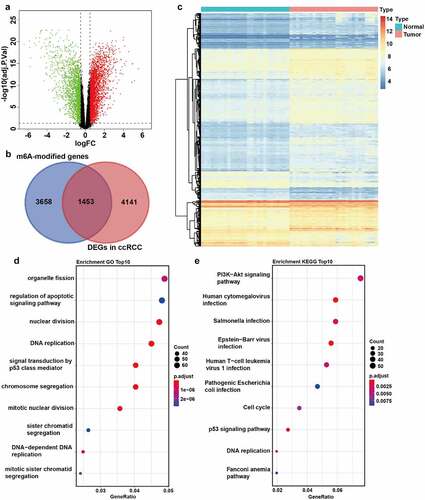
Figure 2. Construction of weighted co-expression modules. A The scale-free topology model fits the index for various soft threshold powers. B The mean connectivities for various soft threshold powers. C Checking the scale-free R2 when the power of β = 5. D The cluster dendrogram of the m6A-modified DEGs in GSE66272. E The clustering of module eigengenes (MEs). F The number of genes in different modules
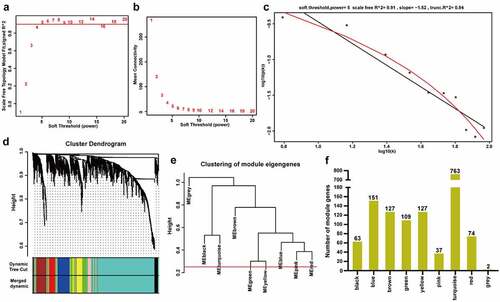
Figure 3. Analysis of clinically relevant modules and hub m6A-modified genes. A The modules yielded in the clustering analysis are summarized by ME dendrogram and network heatmap. B The heatmap of the correlations between clinical traits and MEs. C-E Scatterplot visualizes the ModuleMembership and GeneSignificance of genes in the turquoise module based on grade (c), stage (d) and metastasis (e) of GSE66272. r, Pearson correlation coefficient. p, P value. F The Venn plot of the most clinically significant genes. G Protein-protein network of genes with weight > 0.8. Red represents the genes that belong to both turquoise module and PPI network, blue represents the genes that only belong to PPI network
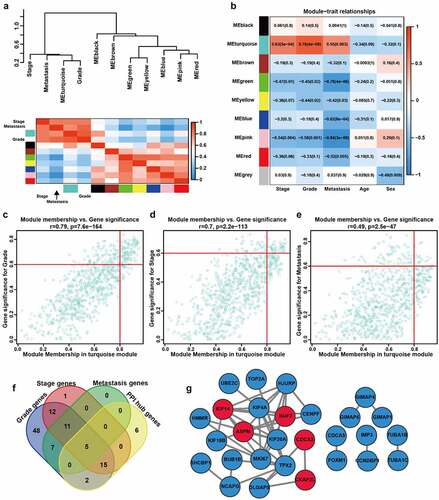
Figure 4. METTL14 regulates the m6A and expression levels of NUF2, CDCA3, and KIF14. A-C Pearson correlation analysis of METTL14 and NUF2 (a), CDCA3 (b), KIF14 (c) in TCGA dataset. r, Pearson correlation coefficient. p, P value. D The m6A RIP qPCR assay shows the enrichment levels of m6A modification in NUF2, CDCA3, and KIF14 transcripts. E The relative expression of NUF2, CDCA3, and KIF14 after METTL14 knockdown in 769-P cells
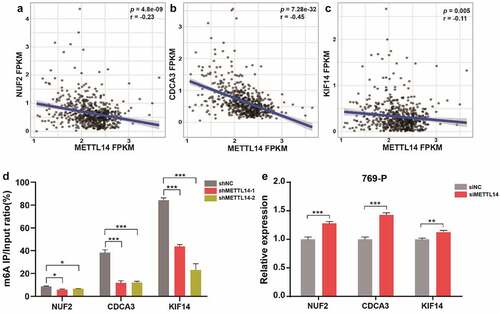
Figure 5. Survival and ROC analysis of METTL14 and NUF2, CDCA3, and KIF14. A-C Kaplan-Meier analysis of overall survival based on METTL14 and NUF2 (a), CDCA3 (b), KIF14 (c) in TCGA ccRCC patients. D-F Combined ROC curves of METTL14 and NUF2 (d), CDCA3 (e), and KIF14 (f) according to the expression levels
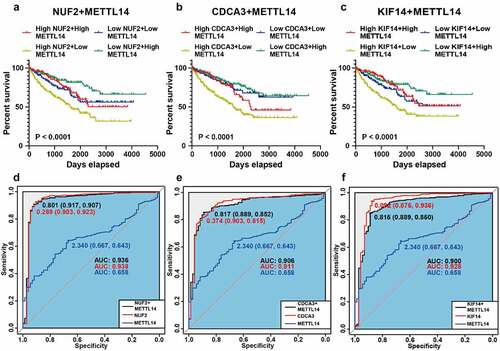
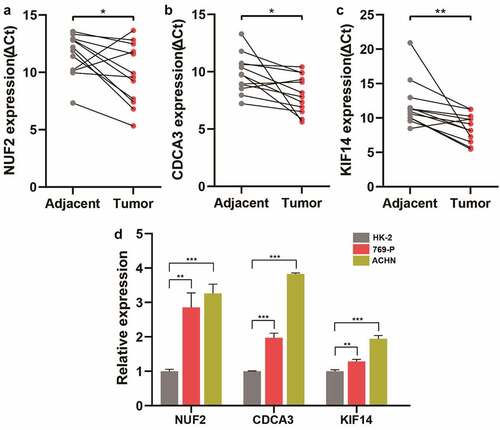
Figure 6. Validation of NUF2, CDCA3, and KIF14 in ccRCC tissues and cell lines. A-C Detection of NUF2 (a), CDCA3 (b), and KIF14 (c) expression levels in 12 paired ccRCC and normal kidney tissues by qPCR. The expression levels of these three genes were normalized to the reference gene GAPDH. ΔCt, delta threshold cycle. D Detection of NUF2, CDCA3, and KIF14 expression levels in kidney cell lines by qPCR