
Figures & data
Figure 1. Expression of CA12 protein in different breast cell lines (x ± s, n = 3) by western blot.(a) The expression of CA12 protein in different breast cell lines; (b) The relative expression of CA12 protein in different breast cell lines; **: Comparison between groups, P < 0.01
Figure 2. Effects of siRNA transfection on the expression of CA12 protein in MCF-7 and MCF-7 TaxR cells (n = 3). (a)The expression of CA12 protein in MCF-7 and MCF-7 TaxR cells after siRNA transfection; (b) The relative expression of CA12 protein in MCF-7 and MCF-7 TaxR cells after siRNA transfection. *: Compared with the two control groups (blank+negative), P < 0.05
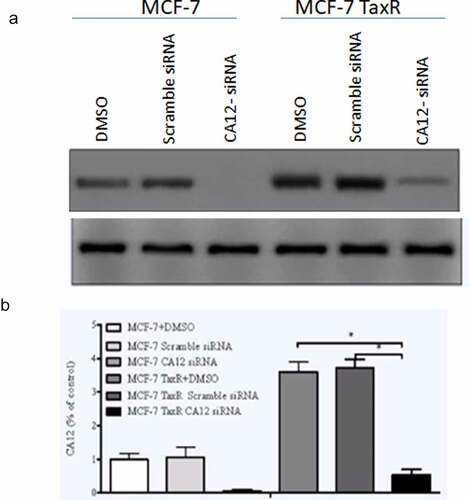
Figure 3. After CA12-siRNA transfection the survival rates of MCF-7 TaxR cells.(a) Survival curve of MCF-7 TaxR cells treat with paclitaxel (x ± s, n = 3); (b) Paclitaxel sensitivity of MCF-7 TaxR after CA12-siRNA transfection (x ± s, n = 3). Compared with the negative control group (Scramble siRNA), *P < 0.05;**P < 0.01
Figure 4. CA12-siRNA transfection combined with paclitaxel induces apoptosis of MCF-7 TaxR cells. (a) Morphological observation of MCF-7 cells after siRNA transfection; (b) Hoechst 33,342 fluorescence staining observation of MCF-7 cells after siRNA transfection;(c) Morphological observation of MCF-7 TaxR cells after siRNA transfection; (d) Hoechst 33,342 fluorescence staining observation of MCF-7 TaxR cells after siRNA. Scale bar,100 μM
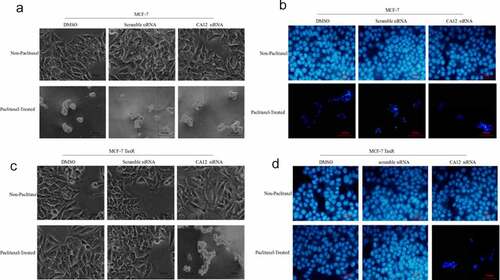
Figure 5. Flow cytometry to detect apoptosis rate. Apoptosis in MCF-7 and MCF-7 TaxR cells after combination siRNA transfection with paclitaxel culture. Compared with the blank control group, *P < 0.05;**P < 0.01. Compared with the negative control group, #P < 0.05; ##P < 0.01
Figure 6. Effects of siRNA transfection and paclitaxel culture on mitochondrial apoptotic signaling pathway in MCF-7 and MCF-7 TaxR cells. (a) Expression of mitochondrial apoptosis-related protein in MCF-7 and MCF-7 TaxR cells;(b) The relative expression of mitochondrial apoptotic pathway-related proteins in MCF-7 and MCF-7 TaxR cell. *: Compared with the experimental group (CA12-siRNA), P < 0.05
Data availability
Data are available from the corresponding author on request.