Figures & data
Figure 1. SNHG8 expression in foot pad is increased by MSU. (a) RT-qPCR disclosed that MSU treatment significantly enhanced the expression of SNHG4, SNHG8 in foot pad tissues of mice. (b) RT-qPCR manifested that SNHG8 expression in foot pad tissues of GA mice was silenced by injection of lentivirus expressing sh-SNHG8. *p < 0.05, **p < 0.01 vs. sham group, #p < 0.05 vs. MSU+ sh-NC group. There were eight mice in each group
Figure 2. Silencing of SNHG8 suppresses paw swelling and inflammation. (a) H&E staining disclosed that MSU-induced paw swelling was rescued by SHNG8 depletion. Red arrows indicate the inflammatory cells. (b) The foot thickness changes in mice after MSU stimulation for 0, 6, 12, 24 h were exhibited. (c) Protein levels of IL-6, TNF-α and IL-1β in foot pad tissues were enhanced by MSU stimulation and decreased by SNHG8 deficiency, as suggested by western blot analysis. (d) ELSIA results revealed that MSU significantly increased the concentrations of IL-6, TNF-α and IL-1β and silenced SNHG8 decreased their concentrations. *p < 0.05 vs. sham group. #p < 0.05 vs. MSU + sh-NC group. There were eight mice in each group
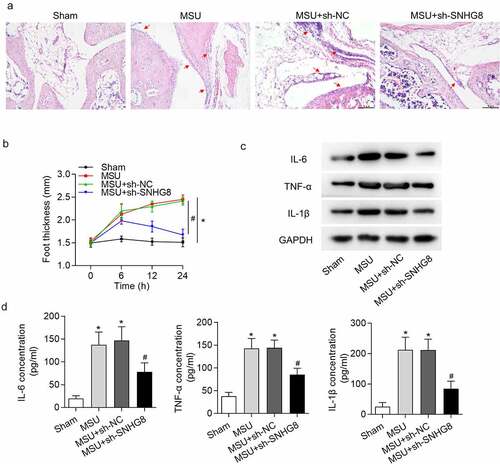
Figure 3. SNHG8 served as a sponge of miR-524-3p. (a) Subcellular fraction assay showed that SNHG8 was mostly distributed in the cytoplasm of THP-1-derived macrophages. (b) Expression of miRNAs in foot pad tissues of mice after MSU treatment was detected by RT-qPCR. *p < 0.05 vs. sham group. There were eight mice in each group. (c) SNHG8 knockdown efficiency in THP-1-derived macrophages was verified by RT-qPCR. (d) RT-qPCR manifested that miR-542-3p expression was significantly enhanced due to SNHG8 silence in THP-1-derived macrophages. *p < 0.05 vs. sh-NC group. (e) RIP assay was conducted to reveal that both SNHG8 and miR-542-3p were enriched in anti-Ago2 group. *p < 0.05 vs. anti-IgG group. (f) RT-qPCR manifested that miR-542-3p was overexpressed by transfection of miR-542-3p mimics in THP-1-derived macrophages. *p < 0.05 vs. NC mimics group. (g) Bioinformatics analysis predicted the binding sites for SNHG8 and miR-542-3p. (h) Luciferase reporter assay was utilized to further identified the binding possibility between SNHG8 and miR-542-3p. *p < 0.05 vs. NC mimics group. Each biological sample was run in triplicate and experiments were independently repeated three times for the in vitro studies
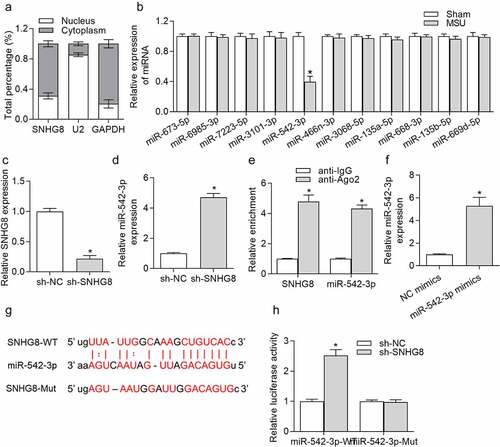
Figure 4. AP3D1 was a direct target of miR-542-3p. (a) Venn diagram showed that there were four potential targets of miR-542-3p, including AP3D1, PTEN, PPP1CD and ARPC1A, according to data from PicTar, PITA, miRmap, miRanda and microT databases. (b) RT-qPCR showed that 24 h of MSU treatment increased AP3D1 expression and had no effects on the expression of PTEN, PPP1CD and ARPC1A in foot pad tissues of mice. *p < 0.05 vs. sham group. There were eight mice in each group. (c) RT-qPCR demonstrated that AP3D1 expression was declined by miR-542-3p upregulation or SNHG8 ablation in THP-1-derived macrophages. *p < 0.05 vs. NC mimics or sh-NC group. (d) Western blot analysis indicated that the protein level of AP3D1 was decreased by overexpression of miR-542-3p or downregulation of SNHG8. (e) The coexistence of SNHG8, miR-542-3p and AP3D1 in RISC was confirmed by RIP assay. *p < 0.05 vs. anti-IgG group. (f) The potential binding site for miR-542-3p and AP3D1 3ʹUTR was shown based on the starBase online tool. (g) The binding capacity of miR-542-3p and AP3D1 3ʹUTR was confirmed by luciferase reporter assay. *p < 0.05 vs. NC mimics group. (h) RT-qPCR manifested that SNHG8 expression was overexpressed by pcDNA3.1/SNHG8. *p < 0.05 vs. pcDNA3.1 group. (i) Luciferase reporter assay was conducted to detect the luciferase activity of AP3D1-WT and AP3D1-MUT in cells transfected with NC mimics, miR-542-3p mimics, or cotransfected with miR-542-3p mimics+SNHG8. *p < 0.05 vs. NC mimics group, #p < 0.05 vs. miR-542-3p mimics group. Each biological sample was run in triplicate and experiments were independently repeated three times for the in vitro studies
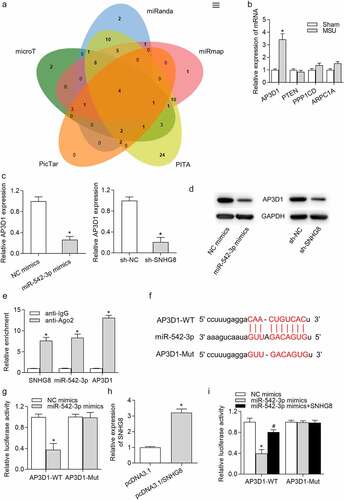
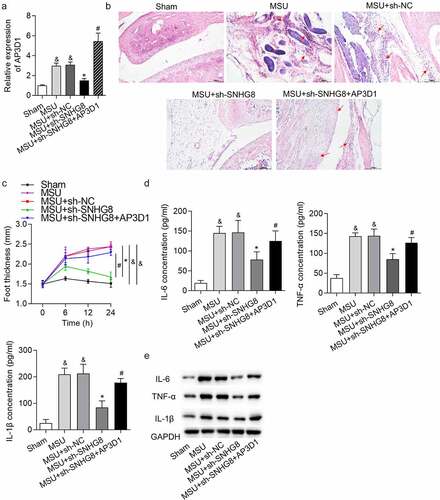
Figure 5. SNHG8 contributed to GA progression by upregulating AP3D1. (a) RT-qPCR showed that AP3D1 was upregulated in foot pad tissues of an MSU-induced GA mice model. (b) H&E staining showed that AP3D1 upregulation rescued the inhibitory impact of SNHG8 deficiency on mice paw swelling. Red arrows indicate the inflammatory cells. (c) The changes of foot thickness were displayed in the curve graphs. (d-e) ELISA and western blot analysis showed that upregulation of AP3D1 countervailed the SNHG8 depletion-triggered inhibition on IL-6, TNF-α and IL-1β levels in foot pad tissues. &p < 0.05 vs. sham group, *p < 0.05 vs. MSU + sh-NC group, #p < 0.05 vs. MSU + sh-SNHG8 group. There were eight mice in each group