Figures & data
Figure 1. Distinct expression patterns of E2F2 and mir-125a-5p were observed in traumatic OA cartilage. A, Possible targeting relationship within mir-125a-5p and E2F2 was given by targetscan and Starbase databases. B, Verification of dual luciferase assay on the targeting relationship within mir-125a-5p and E2F2. C, Determination with RT qPCR assay on the expression of mir-125a-5p and E2F2 in normal cartilage and traumatic OA cartilage. D, Western blot was conducted to determinate the E2F2 expression in normal cartilage and traumatic OA cartilage. ** means P < 0.01, compared with normal group or mimics NC transfected cells
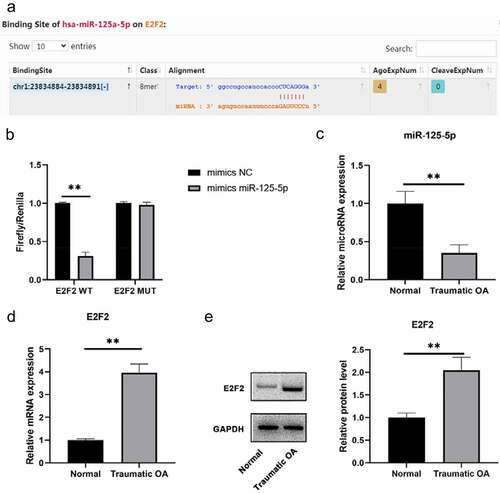
Figure 2. Identification of BMSCs and exosomes. A, Observation with transmission electron microscope on morphology of exosomes. B, Western blot analysis of secrete surface markers (CD63, CD9). C, RT-qPCR on the mir-125a-5p expressions in BMSCs and their exosomes. * P < 0.05, ** P < 0.01
Figure 3. Targeting effect of mir-125a-5p to E2F2 leads to enhancement in both chondrocyte migration and ECM synthetic proteins. A, RT-qPCR assay on the mir-125a-5p expression in transfected chondrocytes. B and C, Migration analyses on chondrocytes. Scar bar = 100 μm. 1, mimics NC; 2, mimics miR-125a-5p; 3, inhibitor NC; 4, inhibitor miR-125a-5p; mimics miR-125a-5p + E2F2. D, RT-qPCR assays on the MMP-13, collagen II, aggrecan and Sox9 mRNA expressions. *Compared with the cells transfected with mimics NC, P < 0.05; # Compared with the cells transfected with inhibitor NC, P < 0.05; @ Compared with cells transfected with mimics mir-125a-5p, P < 0.05
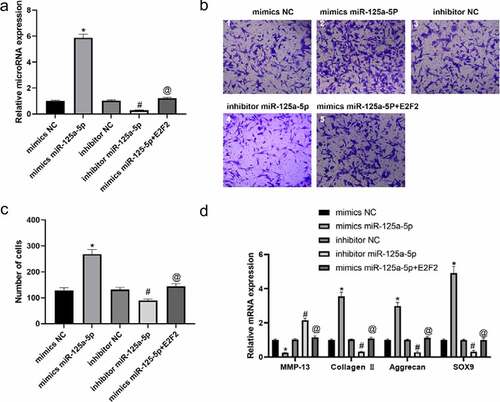
Figure 4. The protein expression of MMP-13, collagen II, aggrecan and Sox9 in chondrocytes were detected by immunofluorescence. * Compared with the cells transfected with mimics NC, P < 0.05; # Compared with the cells transfected with inhibitor NC, P < 0.05; @ Compared with cells transfected with mimics mir-125a-5p, P < 0.05
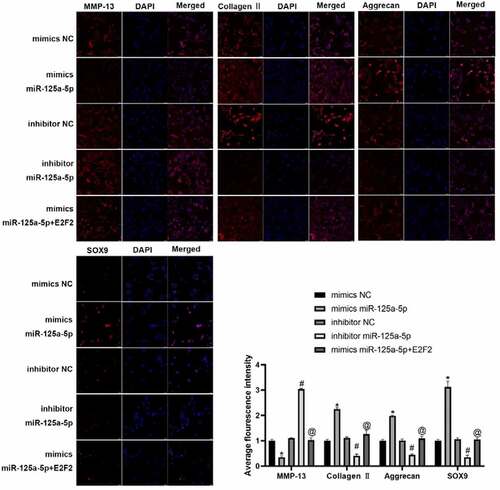
Figure 5. Exosomal miR-125a-5p accelerates chondrocyte migration and secretion of ECM synthetic proteins. A, The typical immunofluorescence pattern of DIO (green)-labeled BMSCs-Exosabsorbed by chondrocytes was that their nuclei were stained with DAPI (blue). B, The RT-qPCR assay to determinate the mir-125a-5p expression in transfected BMSCs. C, The RT-qPCR determination on the mir-125a-5p expression in the exosomes of transfected BMSCs. D, The RT qPCR determination on the mir-125a-5p expression in chondrocytes. E and F, Western blot analysis on the E2F2 protein in exosome-treated chondrocytes. G and H, Migration analysis on chondrocytes. I, The RT-qPCR assay on the mRNA determination of MMP-13, collagen II, aggrecan and Sox9 expressions. ** P < 0.01, represents a comparison with the exoago NC or cellago NC group
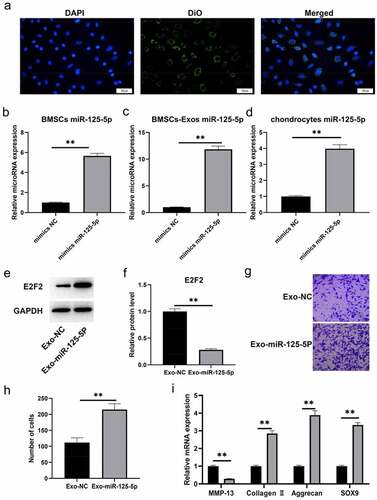
Figure 6. Exo mir-125a-5p inhibits cartilage degradation. A, RT-qPCR assays for the determination to E2F2, collagen II, aggrecan and MMP-13 expressions. B, Protein expressions of E2F2, collagen II, aggrecan and MMP-13 were detected by western blot.*P < 0.05, compared with sham operated mice; #P < 0.05, compared with traumatic OA group