
Figures & data
Table 1. Various viral diagnostic methods and their advantages and disadvantages
Figure 1. A schematic view representing the fundamentals of the nanopore sensing method. a) The flow of Ions across the nanopore as a reason for an applied electric potential across cell membrane. Passage of a protein (of interest) partially blocks the ionic flow which results in a drop in the pore’s ionic current. Once the protein is translocated, the ion flow is restored. b) A representative graph of monitoring the ionic current over time shows a single molecule (protein) translocation. By processing the data, the nanopore data and characteristics are extracted from the current-time response
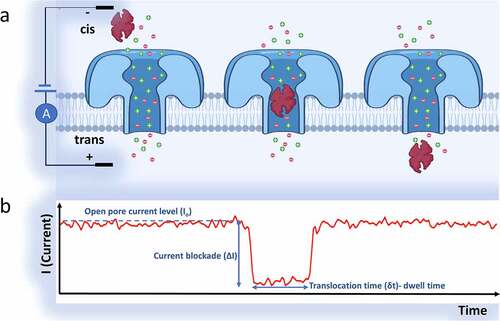
Figure 2. a) A biological nanopore (Aerolysin protein, dia. ~1–1.7 nm) inserted in a lipid bilayer for in vitro detection applications. b) A solid-state nanopore which is fabricated within a Si3N4 membrane layer. The nanopore’s diameter can be tuned finely (usually ranges more than 2 nm). The solid-state nanopore’s shape can be a cone, cylinder, or an hourglass, based on the fabrication techniques. The membrane thickness in cylindrical nanopores defines the depth of the nanopore (usually ranges between 10–200 nm). Using semiconductor processing methods or surface chemistry, the solid-state silicon nitride nanopores can be easily modified
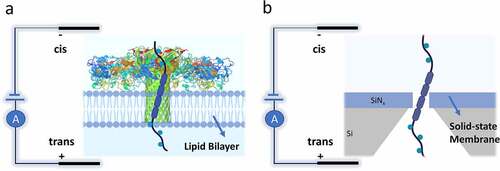
Table 2. Structure, Properties, and analyte types of frequently used biological ion channels (nanopores)
Table 3. Most common materials for fabrication of solid-state nanopores
Table 4. Fabrication methods of solid-state nanopores
Figure 3. Nanopore sensors integrated with microfluidic and optofluidic devices. a) A solid-state nanopore (silicon dioxide) integrated with optofluidic device for single nanoparticles’ simultaneous electro-optical analysis. Liquid-core and solid-core waveguides on a silicon chip are shown in blue and Orange, respectively. Electrodes and particles are in metallic reservoirs. The inset demonstrates a magnified schematic view of particle translocation through the nanopore. The red zone demonstrates the optical excitation volume. Adapted from ref [Citation106]. with permission. b) A schematic diagram of the microfluidic integrated nanopore biosensor with on-chip purification/ bioassay and multilayer fluidic channels. i) Assembly of microfluidic chip. ii) Top view. iii) Cross‐section of the device zoomed‐in at nanopore chambers. iv) The assembled microfluidic chip. Inset is the nanopore’s TEM image. Reproduced from ref [Citation107]. with permission of John Wiley & Sons, Ltd
![Figure 3. Nanopore sensors integrated with microfluidic and optofluidic devices. a) A solid-state nanopore (silicon dioxide) integrated with optofluidic device for single nanoparticles’ simultaneous electro-optical analysis. Liquid-core and solid-core waveguides on a silicon chip are shown in blue and Orange, respectively. Electrodes and particles are in metallic reservoirs. The inset demonstrates a magnified schematic view of particle translocation through the nanopore. The red zone demonstrates the optical excitation volume. Adapted from ref [Citation106]. with permission. b) A schematic diagram of the microfluidic integrated nanopore biosensor with on-chip purification/ bioassay and multilayer fluidic channels. i) Assembly of microfluidic chip. ii) Top view. iii) Cross‐section of the device zoomed‐in at nanopore chambers. iv) The assembled microfluidic chip. Inset is the nanopore’s TEM image. Reproduced from ref [Citation107]. with permission of John Wiley & Sons, Ltd](/cms/asset/ff069f50-29ef-4d73-bfd4-4c00e5dd7ef0/kbie_a_1995991_f0003_oc.jpg)
Table 5. The main methods for surface modification of solid-state nanopores and their primary applications
Figure 4. Characterization of antibody binding to virus particles. A) Detection of single viruses with monitoring resistive pulses (transient current reduction) upon translocation of virions through nanopore (dotted line is mean of current spikes. B) Detection of virus-antibody conjugates. Antibody addition cause volume increase of translocating particles which increase the peak amplitude upon passing through the pore. Reproduced from ref [Citation20]. with permission of John Wiley & Sons, Ltd
![Figure 4. Characterization of antibody binding to virus particles. A) Detection of single viruses with monitoring resistive pulses (transient current reduction) upon translocation of virions through nanopore (dotted line is mean of current spikes. B) Detection of virus-antibody conjugates. Antibody addition cause volume increase of translocating particles which increase the peak amplitude upon passing through the pore. Reproduced from ref [Citation20]. with permission of John Wiley & Sons, Ltd](/cms/asset/05ded224-4f2c-46f5-841b-9726e45779a5/kbie_a_1995991_f0004_b.gif)
Figure 5. a) Detection of Single-influenza-virus using a Si3N4 nanopore. i) Nanopore measurements schematic. Applied bias voltage (Vb) causes electrophoretic translocation of influenza virions in chorioallantoic fluid to pass through the nanopore. ii) Resistive pulse in cross-membrane ionic current upon translocation of single virus. iii) Ionic current traces for fluids containing different Influenza subtypes. Adapted with permission from ref [Citation17]. Copyright {2018} American Chemical Society. b)Detection of Single-influenza-virus using a Au/Si3N4 nanopore modified with peptide probes. i) The interactions between virus and surface peptides. ii) Enlarged views of the resistive pulses acquired in a influenza A(H1N1) containing buffer solution with Si3N4 (Orange) and P2 (ASHRVGSTYIAC) modified nanopores (red). The residence time (tdwell) of viruses in the peptide-modified pore pore increases due to temporal trapping of the virions on the wall surface The inset shows the molecular structure of P2. Adapted with permission from ref [Citation21]. Copyright {2018} American Chemical Society
![Figure 5. a) Detection of Single-influenza-virus using a Si3N4 nanopore. i) Nanopore measurements schematic. Applied bias voltage (Vb) causes electrophoretic translocation of influenza virions in chorioallantoic fluid to pass through the nanopore. ii) Resistive pulse in cross-membrane ionic current upon translocation of single virus. iii) Ionic current traces for fluids containing different Influenza subtypes. Adapted with permission from ref [Citation17]. Copyright {2018} American Chemical Society. b)Detection of Single-influenza-virus using a Au/Si3N4 nanopore modified with peptide probes. i) The interactions between virus and surface peptides. ii) Enlarged views of the resistive pulses acquired in a influenza A(H1N1) containing buffer solution with Si3N4 (Orange) and P2 (ASHRVGSTYIAC) modified nanopores (red). The residence time (tdwell) of viruses in the peptide-modified pore pore increases due to temporal trapping of the virions on the wall surface The inset shows the molecular structure of P2. Adapted with permission from ref [Citation21]. Copyright {2018} American Chemical Society](/cms/asset/1c4d8337-3a31-4cf7-a420-5889658f4604/kbie_a_1995991_f0005_oc.jpg)
Figure 6. Solid-state nanopore sensor for detection of coronavirus. a) Structure of the fabricated nanopore in a Si3N4 membrane. Cis and trans channels contain the specimen and buffer and are connected to Ag/AgCl electrodes for signal transduction. b) The photographic image of the developed nanopore chip. Adapted with permission from ref [Citation145]. Copyright {2021} Springer nature
![Figure 6. Solid-state nanopore sensor for detection of coronavirus. a) Structure of the fabricated nanopore in a Si3N4 membrane. Cis and trans channels contain the specimen and buffer and are connected to Ag/AgCl electrodes for signal transduction. b) The photographic image of the developed nanopore chip. Adapted with permission from ref [Citation145]. Copyright {2021} Springer nature](/cms/asset/0eb00f60-893c-4c82-bac4-e248025145a2/kbie_a_1995991_f0006_oc.jpg)
Table 6. Summary of nanopore sensors used for detection of viruses