Figures & data
Figure 1. EGCG suppressed H/R-resulted H9c2 cell viability reduction and apoptosis
Following H/R stimulation and 2, 4, 8, 16, 32, or 64 mg/L EGCG treatment, H9c2 cell viability was checked by CCK-8 assay (a) and cleaved-caspase 3 in cells was tested via western blotting (b). Following H/R stimulation and 8 mg/L EGCG treatment, the H9c2 cell viability was checked via CCK-8 assay (c) and cell apoptosis was tested via Annexin V-FITC/PI staining and flow cytometer (d). **P < 0.01 vs. Control group; #P < 0.05, ##P < 0.01 vs. H/R group.
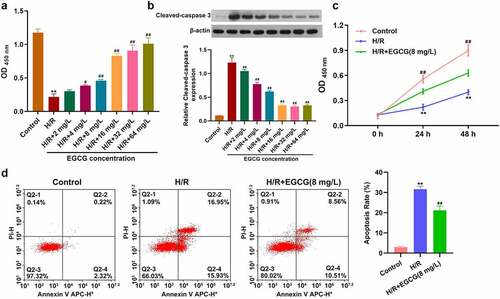
Figure 2. EGCG lessened H/R-resulted ROS generation, ATP loss and mitochondrial damage
Following H/R stimulation and 8 mg/L EGCG treatment, the ROS production of H9c2 cells was measured via DCFH-DA staining and flow cytometer (a), the ATP concentration in H9c2 cells was tested by ATP Assay Kit (b), and the cleaved-Caspase 3, cleaved-Caspase 9, and cytochrome C expressions were evaluated via western blotting (c). **P < 0.01 vs. Control group; ##P < 0.01 vs. H/R group.
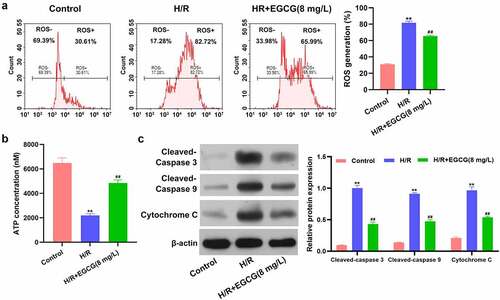
Figure 3. EGCG reversed H/R-resulted reduction of ATG4C expression in H9c2 cells
(a) H9c2 cells were stimulated by H/R and treated by 8 mg/L EGCG, the ATG4C mRNA expression was examined via q-PCR assay. (b) H9c2 cells was transfected OE-ATG4C, the ATG4C mRNA expression was examined via q-PCR assay.
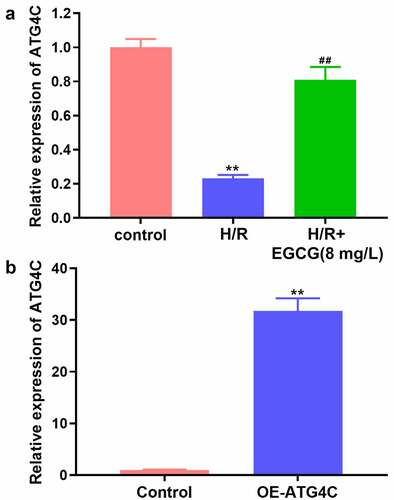
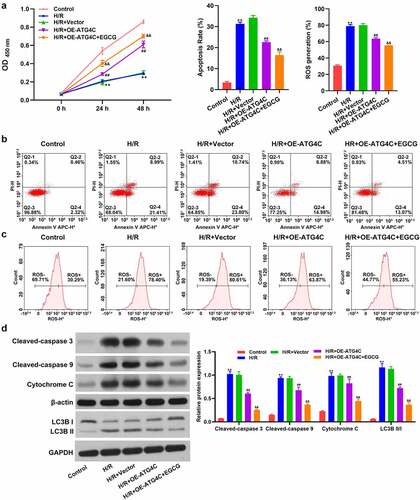
Figure 4. Overexpression of ATG4C strengthened the beneficial influence of EGCG on H/R-treated H9c2 cells
Following H/R stimulation, OE-ATG4C transfection and 8 mg/L EGCG treatment, H9c2 cell viability was checked via CCK-8 assay (a), cell apoptosis = was tested via Annexin V-FITC/PI staining and flow cytometer (b), ROS production was measured via DCFH-DA staining and flow cytometer (c), and cleaved-Caspase 3, cleaved-Caspase 9, cytochrome C, and LC3B expressions were evaluated via western blotting (d). **P < 0.01 vs. Control group; ##P < 0.01 vs. H/R+ Vector group; &&P < 0.01 vs. H/R+ OE-ATG4C group.