Figures & data
Figure 1. Transcriptome landscape of lncRNA ASB16-AS1 and verification analysis inLIHC. (a) The lncRNA expression of ASB16-AS1 between tumor tissues and non-tumor tissues in 33 cancer types of TCGA. (b) ASB16-AS1 expression between tumor and non-tumor tissues of TCGA and GETx (TPM). (c) 7 platform data of GEO database verifred the high ASB16-AS1 expression in LIHC. Except GSE166163_GPL23126, 6 platform data displayed that ASB16-AS1 was highly expressed in LIHC samples, and there were significant differences in 3 platforms (Mann-Whitney U test, GPL570, p <0.001; GPL21047, p =0.019 and GPL6244, p <0.001). The random effect model evaluation model showed that compared with non-tumor samples, ASB16-AS1 was highly expressed in LIHC samples, with an SMD of 0.57 (95% CI: 0.29–0.84)
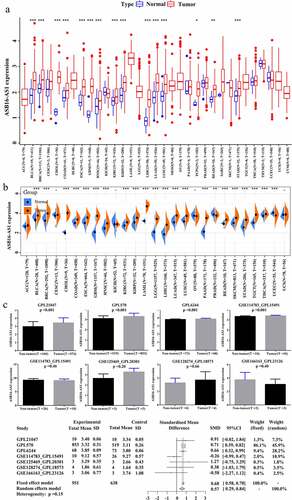
Figure 2. ASB16-AS1 up-regulation promoted LIHC proliferation, migration, and invasion. (a) The expression pattern of ASB16-AS1 in 5 HCC cell lines. (b) The ASB16-AS1 knockdown effect caused by siRNA was evaluated in MHCC97H and MHCC97L cells. (c) CCK8 was used to evaluate the proliferation ability of HCC cell lines. (d-e) Scratch-wound assay and transwell assay were used to evaluate the proliferation, invasion and migration capabilities of HCC cell lines. (f) Flow Cytometry was used to assess the level of apoptosis in HCC cell lines
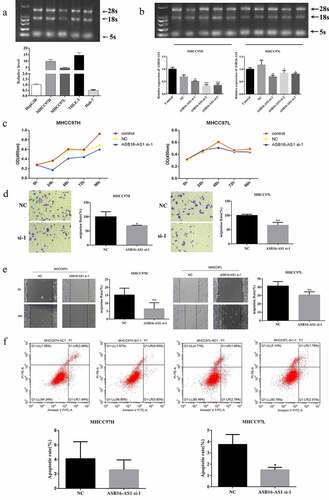
Figure 3. Identification of lncRNA ASB16-AS1 in different stages. (a) ASB16-AS1 was differentially expressed in the overall stages of 5 cancer types by GEPIA analysis. (b) In the comparison of different stages, ASB16-AS1 was differentially expressed in 8 cancer types
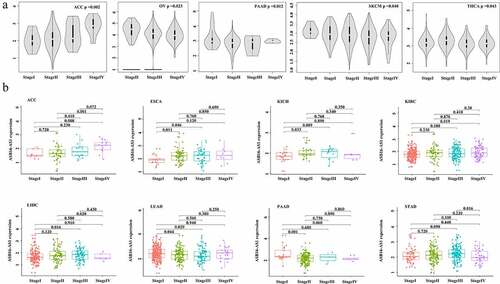
Figure 4. Identification of the prognostic potential of ASB16-AS1 in KIRC and LIHC by multivariate Cox regression analysis. (a) ASB16-AS1 expression was a high risk factor for shorter OS in KIRC. (b) ASB16-AS1 expression was a high risk factor for shorter PFS in LIHC
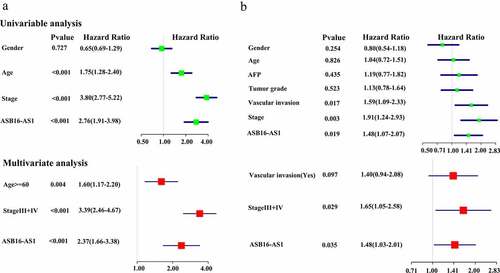
Figure 5. Identification of the relationship between lncRNA ASB16-AS1 and immune infiltration. (a-c) The relationship between ASB16-AS1 expression and tumor microenvironment. a, ImmuneScores; b, StromalScores; and c, TumorPurityScores. (d) Identification of the relationship between ASB16-AS1 and 6 types of immune cells based on data from multiple immune cell evaluation methods. (e) Identification of the relationship between ASB16-AS1 and 22 types of immune cells based on CIBERSORT data. (f) CIBERSORT-ABS data further validated the results of the above 22 types of immune cells. (g) GEO’s GPL570 platform data verified the relationship between ASB16-AS1 and 22 types of immune cells in LIHC
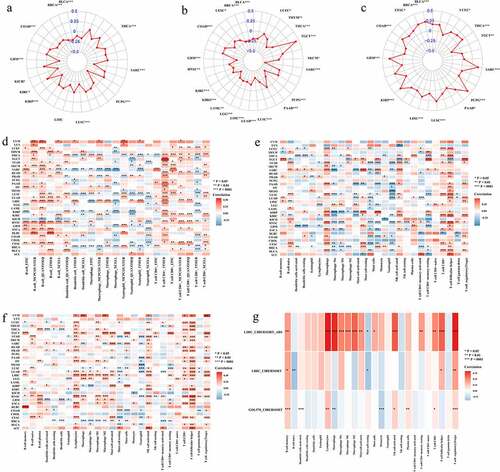
Figure 6. Identification of the relationship between ASB16-AS1 and potential prognostic biomarkers of immunotherapy. The relationships between ASB16-AS1 and immune checkpoint genes (a), TMB (b), MSI(c). (d) ASDB16-AS1 expression in different immune subtypes in BRCA (p <0.001), LIHC (p =0.001), LUAD (p =0.008), and UCEC (p =0.021)
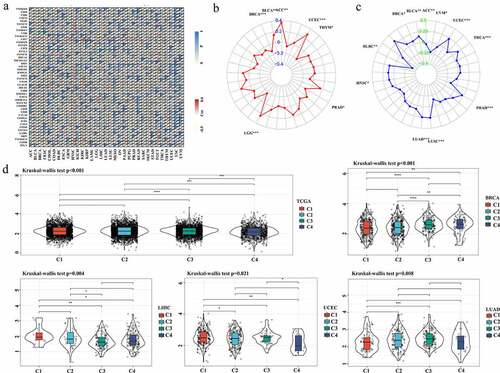
Figure 7. Identification of the relationship between ASB16-AS1 and oncogenic signal pathways. (a) The relationship between ASB16-AS1 and GO pathway in TCGA cancer analyzed by GSEA. (b) The relationship between ASB16-AS1 expression and alterations in 10 common oncogenic signaling pathways
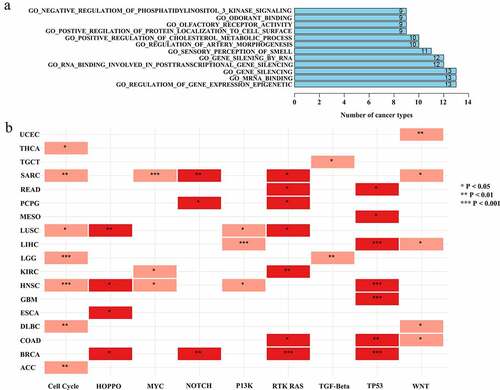
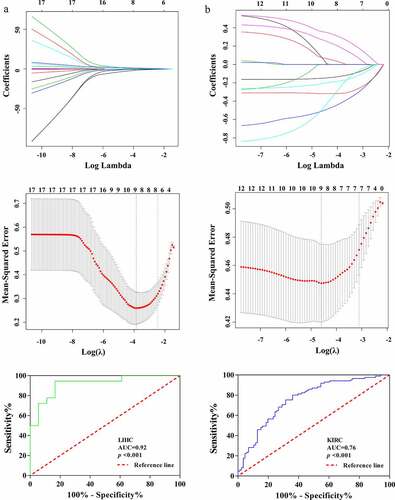
Figure 8. Identification of the relationship between lncRNA ASB16-AS1 andradiomics. ASB16-AS1 expression was significantly positively correlated with many radiomics features types. InIn LIHC, ASB16-AS1 expression was more correlated with radiomics features. The radiomics models identified the high and low expression of ASB16-AS1 (LIHC, AUC =0.92; KIRC, AUC =0.76) had good value