Figures & data
Figure 1. Viability of adipocytes treated with different concentrations of (a) BBR and (b) Rb1. Cell viability was determined by performing MTT assays. * indicates p < 0.05 and ** indicates p < 0.01 when data are compared to those obtained at 0 μM
Figure 2. Synergistic effects of BBR and Rb1 on inflammation and the proliferation of TNF-α-treated adipocytes. (a) Cell viability was determined via MTT assay (**, p < 0.01, compared to Control; ##, p < 0.01, compared to TNF-α; &, p < 0.05, compared to BBR or Rb1). (b) IL-6, IL-1β, and TNF-α levels were measured by performing ELISA (**, p < 0.01, compared to Control; ##, p < 0.01, compared to TNF-α; &, p < 0.05, compared to BBR or Rb1; &&, p < 0.01, compared to BBR or Rb1). (c) The expression levels of Bcl-2 and cleaved caspase-3 were determined in western blot assays (**, p < 0.01, compared to Control; #, p < 0.05, compared to TNF-α; ##, p < 0.01, compared to TNF-α; &, p < 0.05, compared to BBR or Rb1; &&, p < 0.01, compared to BBR or Rb1)
Figure 3. BBR and Rb1 synergistically suppressed adipogenesis and insulin resistance in TNF-α-treated adipocytes. (a) Adipogenesis was evaluated via oil red O staining assay (**, p < 0.01, compared to Control; ##, p < 0.01, compared to TNF-α; &, p < 0.05, compared to BBR or Rb1). (b) The gene and protein expression levels of PPAR-γ, C/EBPα, and SREBP-1 c were measured by performing RT-PCR and western blot assays, respectively (**, p < 0.01, compared to Control; ##, p < 0.01, compared to TNF-α; &&, p < 0.01, compared to BBR or Rb1). (c) The gene and protein expression levels of IRS-1 and GLUT4 were measured via RT-PCR and western blot assays, respectively (**, p < 0.01, compared to Control; ##, p < 0.01, compared to TNF-α; &, p < 0.05, compared to BBR or Rb1; &&, p < 0.01, compared to BBR or Rb1)
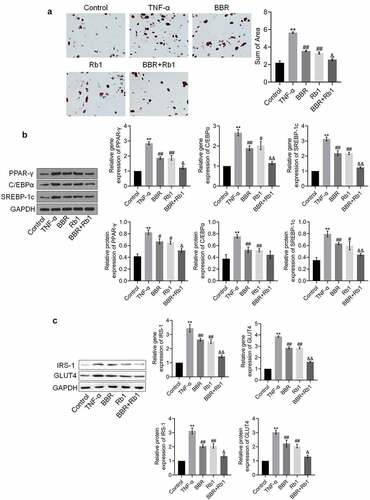
Figure 4. BBR and Rb1 synergistically inhibited the NF-κB pathway in TNF-α-treated adipocytes. (a) The transcriptional activity of NF-κB was evaluated by determining the luciferase activity of NF-κB promoter (**, p < 0.01, compared to Control; ## p < 0.01, compared to TNF-α; &&, p < 0.01, BBR or Rb1). (b) The expression level of NF-κB p65 was evaluated in an immunofluorescence assay (**, p < 0.01, compared to Control; ##, p < 0.01, compared to TNF-α; &&, p < 0.01, compared to BBR or Rb1). (c) The expression levels of p-IKK, IKK-β, p-p65, and p65 were measured in western blot assays (**, p < 0.01, compared to Control; #, p < 0.05, compared to TNF-α; ##, p < 0.01, compared to TNF-α; &, p < 0.05, compared to BBR or Rb1)
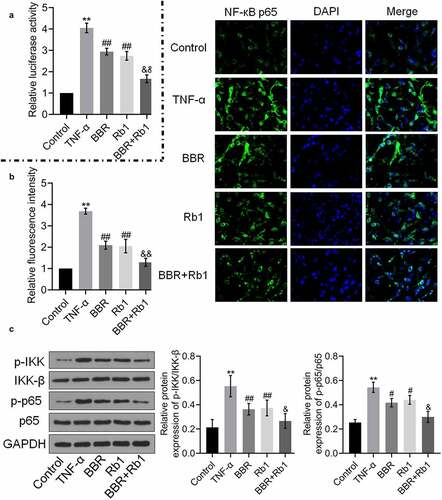
Figure 5. RANKL inhibited the effects of BBR+Rb1 on inflammation and the proliferation of TNF-α-treated adipocytes. (a) Cell viability was determined via an MTT assay (**, p < 0.01, compared to Control; ##, p < 0.01, compared to TNF-α; &&, p < 0.01, compared to BBR+Rb1). (b) IL-6, IL-1β, and TNF-α levels in the different groups were measured be performing ELISA (**, p < 0.01, compared to Control; ##, p < 0.01, compared to TNF-α; &&, p < 0.01, compared to BBR+Rb1). (c) The expression levels of Bcl-2 and cleaved caspase-3 were determined in western blot assays (**, p < 0.01, compared to Control; ##, p < 0.01, compared to TNF-α; &&, p < 0.01, compared to BBR+Rb1)
Figure 6. RANKL inhibited the effects of BBR+Rb1 on adipogenesis and insulin resistance in TNF-α-treated adipocytes. (a) Adipogenesis was evaluated by performing oil red O staining assay (**, p < 0.01, compared to Control; ##, p < 0.01, compared to TNF-α; &&, p < 0.05, compared to BBR+Rb1). (b) The gene and protein expression levels of PPAR-γ, C/EBPα, and SREBP-1 c were measured in RT-PCR and western blot assays, respectively (**, p < 0.01, compared to Control; ##, p < 0.01, compared to TNF-α; &&, p < 0.05, compared to BBR+Rb1). (c) The gene and protein expression levels of IRS-1 and GLUT4 were measured in RT-PCR and western blot assays, respectively (**, p < 0.01, compared to Control; ##, p < 0.01, compared to TNF-α; &&, p < 0.01, compared to BBR+Rb1)
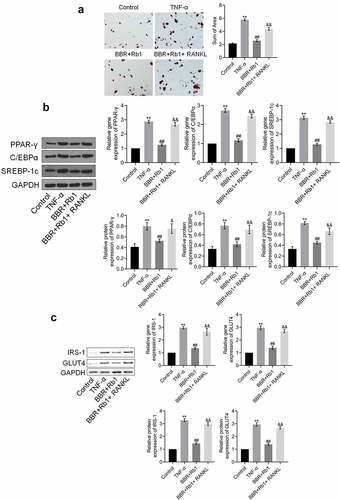
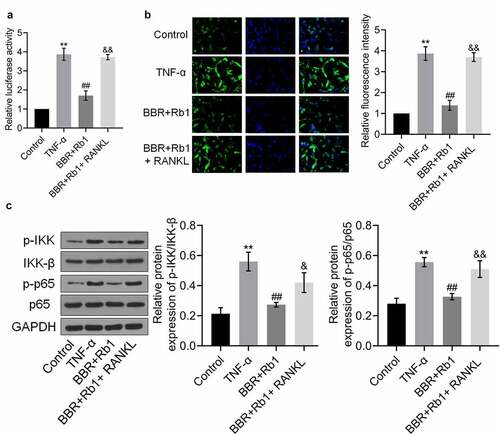
Figure 7. RANKL inhibited the effects of BBR+Rb1 on the NF-κB pathway in TNF-α-treated adipocytes. (a) The transcriptional activity of NF-κB was evaluated by measuring the luciferase activity of NF-κB promoter (**, p < 0.01, compared to Control; ##, p < 0.01, compared to TNF-α; &&, p < 0.01, compared to BBR+Rb1). (b) The expression level of NF-κB p65 was evaluated in an immunofluorescence assay (**, p < 0.01, compared to Control; ##, p < 0.01, compared to TNF-α; &&, p < 0.01, compared to BBR+Rb1). (c) The expression levels of p-IKK, IKK-β, p-p65, and p65 were determined in western blot assays (**, p < 0.01, compared to Control; ##, p < 0.01, compared to TNF-α; &&, p < 0.01, compared to BBR+Rb1)