Figures & data
Figure 1. The expression level of PD-L1 in MG63, HOS/MNNG, Saos-2, SJSA-1, U2OS, SW1353, 143B, T1-73, KHOS/NP, and hFOB 1.19 cells was determined by Western blotting assay
Figure 2. Exosomes were extracted using ultracentrifugation. a. Nanoparticle tracking analysis was used to measure the distribution of particle size (60,000×). b. The ultrastructure of exosomes was visualized by TEM. c. The expression level of HSP70, HSP90, CD63, CD81, PD-1, PD-L1, PD-L2, GRP 94 and GAPDH was detected by Western blotting assay
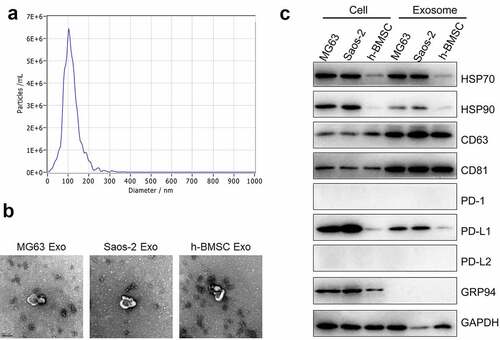
Figure 3. Exosomes extracted from OS cells inactivated Jurkat cells through its loaded PD-L1. a. The production of IFN-γ was determined in MG63 Exosome, Saos-2 Exsome, and hFOB1.19 Exosome by ELISA assay (p < 0.05, p < 0.01). b. Western blotting assay was used to evaluate the expression level of PD-L1 in Jurkat cells treated with PBS, siNC, siPD-L1#1, and siPD-L1#2. c. The secretion of IFN-γ from MG63 cells with or without Exosome and PMA+ionomycn treatment was measured by ELISA assay (p < 0.01)
Figure 4. PD-L1 induced the growth of OS cells. a. The expression level of HSP70, HSP90, CD9, PD-L1, GRP 94 and GAPDH was determined by Western blotting. b. Cell viability was measured by CCK-8 assay. c-d. The in vivo growth of OS cells was evaluated by xenograft model (p < 0.01). e. Flow cytometry was used to determine the proportion of CD3 + T cells in the tumor tissues (p < 0.01)
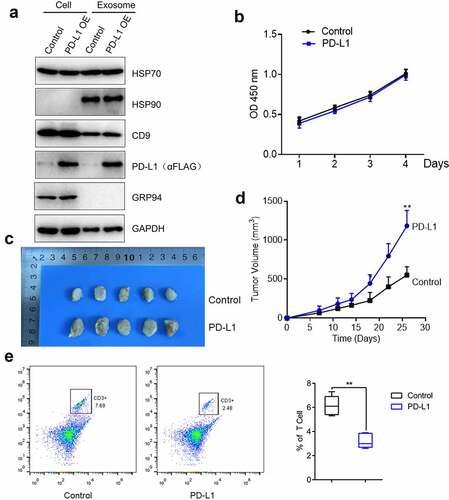
Figure 5. Exosomal PD-L1 induced the growth of OS cells. a-b. The in vivo growth of OS cells was evaluated by xenograft model (p < 0.01). c. Flow cytometry was used to determine the proportion of CD3 + T cells in the tumor tissues (p < 0.05)
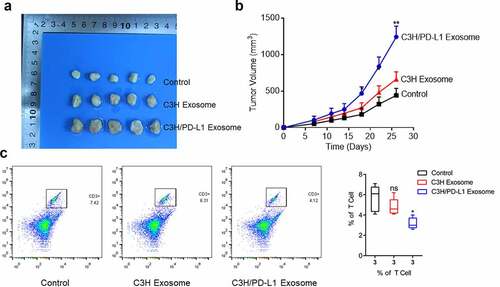
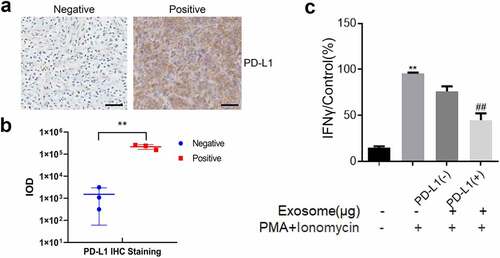
Figure 6. Exosomes extracted from PD-L1 positive OS tissues inactivated Jurkat cells. a. Immunohistochemical assay was used to determine the expression level of PD-L1 in the clinical tumor tissues. The Bar length was 25 μm. b. Relationship between the amount of PD-L1-positive exosomes and the expression of PD-L1 in tumor tissues. c. The production of IFN-γ was determined by ELISA assay (p < 0.01)