
Figures & data
Figure 1. The expression level of ANXA1 in pan-carcinoma: analysis of 501 patients with THCA and 59 healthy subjects showed that ANXA1 was highly expressed in THCA, and the difference was statistically significant(p < 0.05).
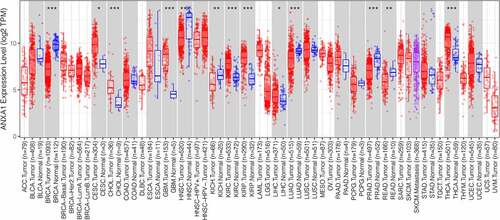
Figure 2. (a)Survival analysis of ANXA1 in pan-cancer showed that the high expression of ANXA1 was associated with higher overall survival in THCA patients, with a statistically significant difference (P = 0.004). (b)Univariate Cox regression was performed on the results of survival analysis, and the results showed that the expression of ANXA1 was not statistically significant in overall survival of THCA.
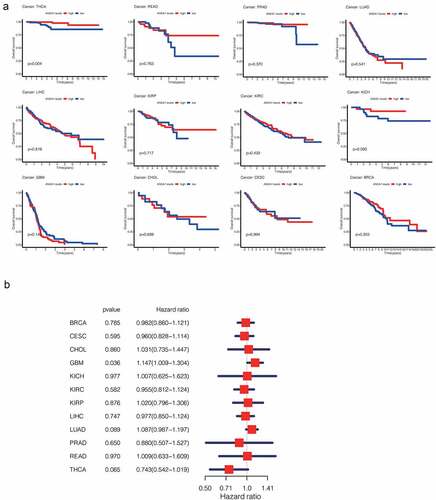
Figure 3. (a) The expression analysis of ANXA1 was refined into the PTC subtype, and the results showed that ANXA1 was significantly highly expressed in PTC (P < 0.05). (b) In 56 pairs of paired PTC and normal samples, the mRNA expression of ANXA1 showed a significant upward trend in tumors (P < 0.05). (c) A survival analysis of 259 PTC patients showed that ANXA1 high expression was a poor prognostic signal for PTC, which is contrary to the results previously obtained in THCA. (d) Differences in the expression of ANXA1 in different stages of PTC, with P values listed in the figure. (e) The expression level of ANXA1 was not statistically significant among different genders (P = 0.03). (f) PTC patients were grouped according to 52 years old. ANXA1 was highly expressed in patients younger than 52 years old, and the difference was statistically significant (P < 0.001). (g) ROC curve of survival analysis: the area under the curve (AUC) was 0.802. (h) Precision-Recall analysis showed that the PRC value was 0.931.
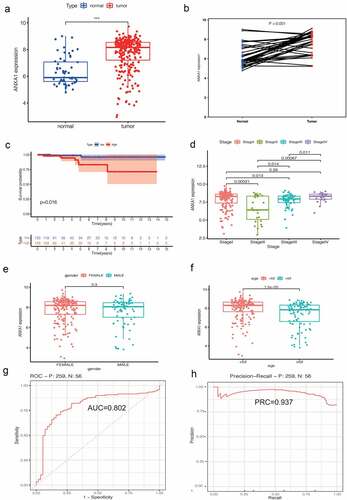
Figure 4. (a) Relative percentages of different immune cells in PTC patients. According to the area of different colors, T cells, monocytes and macrophages accounted for the main part. (b) The high expression of ANXA1 will lead to lower levels of Plasma cells, T cells CD8, T cells regulatory, T cell gamma delta, NK cells activated, Macrophages M0, Dendritic cell resting, Dendritic cell activated, And Eosinophils in PTC patients(P < 0.05) (c) – (f) Immunoinfiltration analysis showed that the expression level of ANXA1 was correlated with 8 kinds of immune cells(p < 0.05).
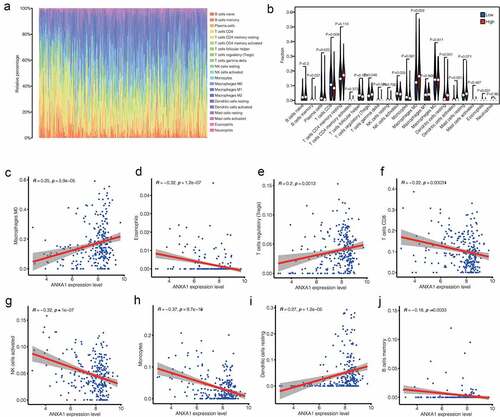
Figure 5. (a) The network of 15 hub transcription factors of ANXA1which includes MYC. (b) We chose the MYC molecule as the study object. Expression analysis in UCSC database showed low expression of MYC gene in PTC patients (P < 0.05). (c) Correlation analysis between MYC and ANXA1 showed that MYC was one of the Hub TFS (COR = 0.39, P < 0.001).(d,e) The protein expression of ANXA1 in normal and PTC.
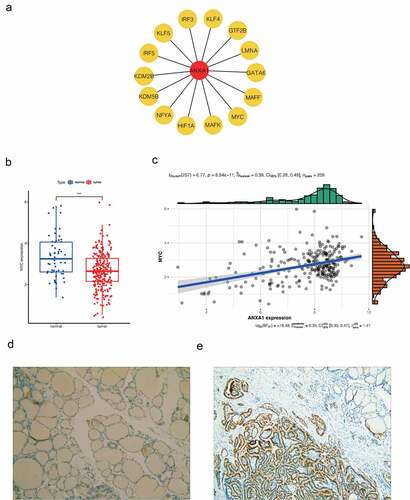
Figure 6. (a)The expression of ANXA1 mRNA in the Nthy-ori 3–1 cell line with overexpression MYC group has a decreased trend, compared with the NC group(P < 0.05). (b)The expression of ANXA1 mRNA in the IHH-4 cell line interference MYC group shows an increasing trend, compared with the NC group (P < 0.05). (c)The expression of ANXA1 protein in the overexpressing MYC group was significantly increased in the Nthy-ori 3–1 cell line(P < 0.05), compared with the control group and NC group. (d)The expression of ANXA1 protein in the interference MYC group showed a downward trend in the IHH-4 cells(P < 0.05), compared with the control group and NC group. (* means treating group compared with Control; # means treating group compared with NC group).
Figure 7. (a) In normal thyroid follicular cells, compared with the control group and the no-load group, thyroid follicular cells with overexpressing MYC promoted significantly cell proliferation at 24 h, 48 h, 72 h, and 96 h (P < 0.05). (b)In papillary thyroid carcinoma cells, compared with the control group and the no-load group, the papillary thyroid carcinoma cells that interfered with MYC significantly inhibited cell proliferation at 24 h, 48 h, 72 h, and 96 h (P < 0.05).
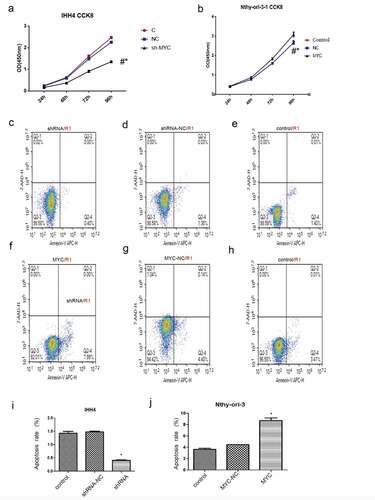
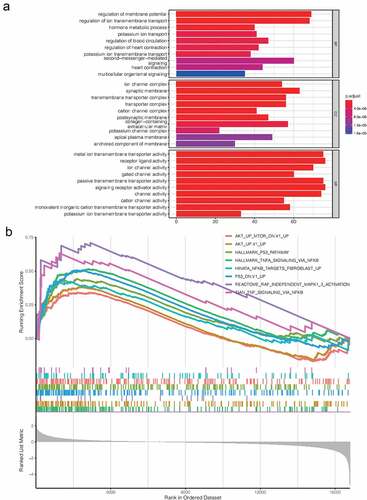
Figure 8. (a) GO enrichment analysis indicates that ANXA1 may function in PTC by regulating the transporter and channel activity. (b) GSEA results suggest that upregulated ANXA1 may active the pathways like p53-Akt signal pathway, mTOR pathway, NF-KB signaling pathway, etc.
Supplemental Material
Download Zip (246.5 KB)Data availability statement
The authors confirm that the data supporting the findings of this study are available within the article.