
Figures & data
Table 1. Characteristics of the included studies
Figure 1. The flowchart of article selection
Figure 2. The primary meta-analysis. The relationship between overall survival (OS) and programmed death ligand 1 (PD-L1) expression. a) PD-L1 protein expression b) PD-L1 messenger ribonucleic acid (mRNA) expression c). The pooled hazard ratio (HR) of all included studies is 1.16 (95% CI, 1.11–1.46; P= 0.001); high heterogeneity is observed across studies (I2 = 56.7%, P= 0.002). After dividing all included studies into two subgroups based on detection index (protein and mRNA); no high heterogeneity is observed within the two subgroups. The results reveal that PD-L1 expression is associated with a poor OS of glioblastoma (GBM) at protein level (HR, 1.30; 95% CI, 1.13–1.48; P< 0.001) and mRNA level (HR, 1.05; 95% CI, 1.00–1.09; P= 0.041)
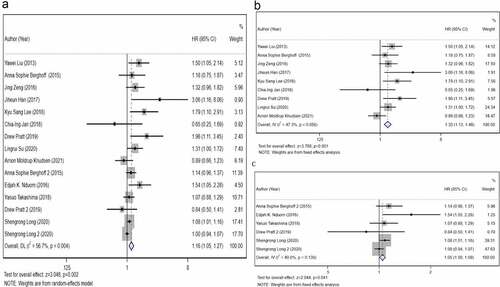
Table 2. Subgroup analysis for the association between programmed death ligand 1 (PD-L1) expression and overall survival (OS)
Figure 3. Analysis of publication bias for the protein subgroup. The results reveal that the funnel plot is symmetrical and the P-values of the Egger’s and Begg’s tests are 0.417 and 0.118, respectively. The symmetrical funnel plot, Egger’s test and Begg’s test reveal no publication bias within the protein subgroup
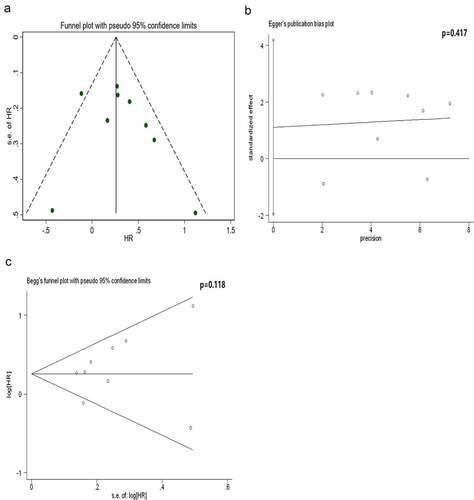
Table 3. Clinical features of the Chinese Glioma Genome Atlas-Glioblastoma (CGGA-GBM) dataset
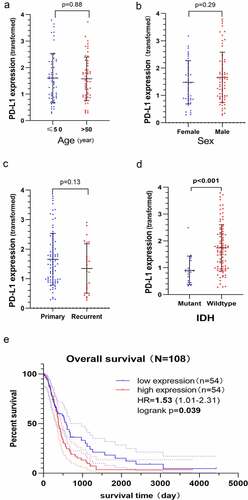
Figure 4. Clinical significance and prognostic value of PD-L1 mRNA expression based on the Chinese Glioma Genome Atlas-Glioblastoma (CGGA-GBM) dataset. The Y-axis represents the expression of PD-L1 mRNA transformed by log2 (1 + x) function. PD-L1 mRNA expression does not correlate with age a) sex b) history of relapse c) however, it correlates with the status of isocitrate dehydrogenase (IDH), and IDH wildtype GBM has higher PD-L1 mRNA expression level d). The Kaplan–Meier curve indicates that high PD-L1 mRNA expression is associated with a poor overall survival (OS) of GBM (HR, 1.53; P= 0.039) E)
Supplemental Material
Download Zip (30.6 KB)Availability of data and materials
All data are provided in the manuscript and can be obtained from the corresponding author.