Figures & data
Table 1. Tumor patients information summary form
Figure 1. Expression of the EphA2 gene in tumor cells and the relationship between EphA2 gene expression and survival prognosis of TCGA tumors. (a) We used the cell panel of the Human Protein Atlas database (http://www.proteinatlas.org) to analyze the level of EphA2 gene expression in each cell line. In male genital tumors, hepatobiliary tumors, and lung cancer tumor cell lines, PC-3, HepG2, and A549 cell lines, the gene expression of EphA2 was more prominent. (b-c) We used the GEPIA2 tool to analyze the relationship between EphA2 gene expression and overall survival (1b) and disease-free survival (1 c) of the different tumors in TCGA database. Survival plots and Kaplan-Meier curves are presented
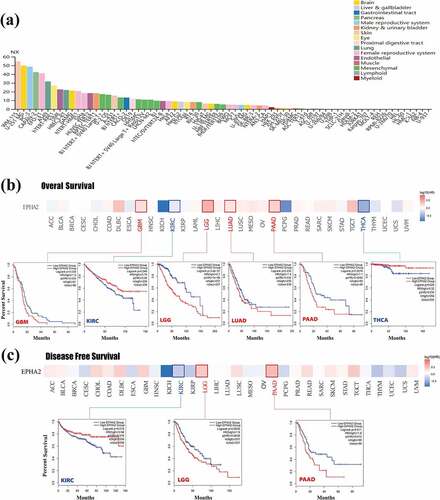
Figure 2. Construction of scFv and analysis of the diversity of phage immune libraries. (a) M is a DL 2,000 bp DNA marker, 1–14 are the amplified VH gene bands. (b) M is DL 2000 bp DNA marker, 1–9 are the amplified Vκ gene bands. (c) M is DL 2,000 bp DNA marker, 1–8 are the amplified Vλ gene bands. (d) scFv to the VH-linker-VL approximately 800 bp in size were obtained by assembling VH-linker-Vκ and VH-linker-Vλ by overlapping extension PCR. M is the DL 2000 bp DNA marker, 1 is the amplified VH-Vκ gene band, and 2 is the amplified VH-Vλ gene band. (e) DNA fingerprints formed by random digestion of scFv from the phage library by restriction enzyme BstN I. M is a DL 1,500 bp DNA marker, 1–21 are sample numbers of different monoclonal colonies from the phage library. (f) DNA fingerprinting formed by the random digestion of scFv by restriction enzyme BstN I after the first round of enrichment affinity sieve. M is a DL 2,000 bp DNA marker, 1–16 are sample numbers of different monoclonal colonies. (g) DNA fingerprinting formed by the random digestion of scFv by the restriction enzyme, BstN I, after a second round of enrichment affinity sieve. M is a DL 2,000 bp DNA marker, 1–13 are sample numbers of different monoclonal colonies. (h) DNA fingerprinting formed by the random digestion of scFv by restriction enzyme BstN I after a third round of enrichment affinity sieve. M is a DL 2,000 bp DNA marker, 1–14 are sample numbers of different monoclonal colonies
Figure 3. Screening for high affinity scFvs. (a) A phage ELISA identified the binding activity of 39 scFv antibodies from the initial screen to the target antigen EphA2. The results at OD450 were used to determine whether the initial screen of phages consistently expressed scFvs. (b) A phage cell ELISA identified the binding of 28 strains of scFv to the EphA2 receptor on PC-3 cells and OD450 values were read. (c) A phage cell ELISA identified the binding of 28 strains of scFv to the EphA2 receptor on HepG2 cells, and OD450 values were read. (d) A phage cell ELISA identified the binding of 28 strains of scFv to the EphA2 receptor on A549 cells, and the OD450 values were read. (n ≥ 3 of per experiment group; ns, not statistically significant; * P < 0.05; ** P < 0.01; and *** P < 0.001. A t-test for group design was used for statistical analysis)
Figure 4. Expression and purification of bivalent recombinant scFv-Fc and full-length IgG1 antibodies. (a) SDS-PAGE results of the EphA2-scFv-Fc recombinant protein. M is the marker, 1 is the blank control; 2, 4, and 6 are the pre-purification bands for recombinant protein 179-scFv-Fc, 14-scFv-Fc, and 77-scFv-Fc; 3, 5, and 7 are the purified protein bands for recombinant protein 179-scFv-Fc, 14-scFv-Fc, and 77-scFv-Fc. (b) The structure of the recombinant vector for scFv-Fc and IgG1. (c) The scFv-Fc antibody structural diagram. (d) SDS-PAGE results of the EphA2-IgG1 recombinant protein. M is the marker; 1–3 are the purified protein bands for recombinant proteins 179-IgG1, 14-IgG1, and 77-IgG1. (e) IgG1 antibody structural diagram. (f) Expression and purification flow chart of scFv-Fc and IgG1
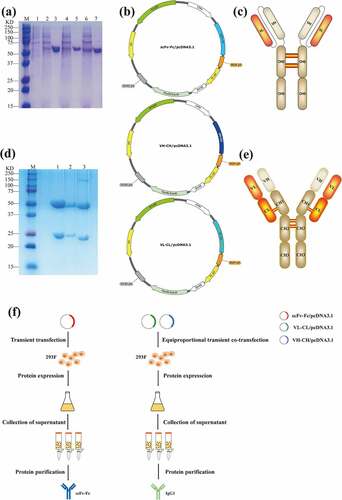
Figure 5. There was a significant increase in antibody affinity after a conversion of the bivalent recombinant scFv-Fc antibody to a full-length IgG1 antibody. (a) scFv-Fc and IgG1 dose-response curves for binding with the biotinylated EphA2 protein. (b) Data regarding the macromolecular interactions of scFv-Fc and IgG1 with biotinylated EphA2 proteins. KD means equilibrium dissociation constant; Ka means combination constant; Kd means dissociation constant (the data are representative of one of three independent experiments)
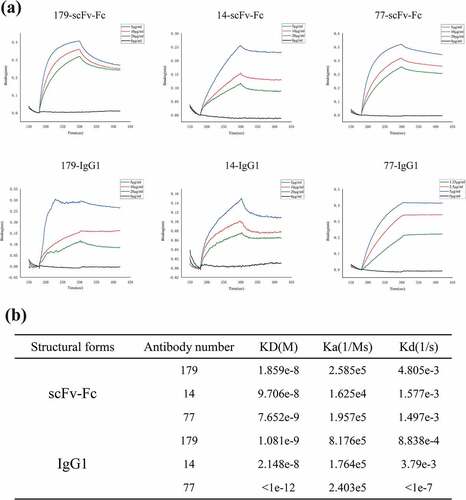
Figure 6. Bivalent recombinant scFv-Fc and full-length IgG1 antibodies bind with high affinity to the EphA2 receptor on the surface of tumor cells. FSC-sorted PC-3 and A549 tumor cells were SSC-labeled. Positive-bound target cells were then circled with controls. (a) The binding of scFv-Fc to EphA2 receptors on PC-3 cells at different concentrations. (b) The binding of IgG1 to EphA2 receptors on PC-3 cells at different concentrations. (c) Changes in the mean fluorescence intensity of scFv-Fc when bound to EphA2 receptors on PC-3 cells at different concentrations. (d) Changes in the mean fluorescence intensity of IgG1 when bound to EphA2 receptors on PC-3 cells at different concentrations. (e) The binding of scFv-Fc to EphA2 receptors on A549 cells at different concentrations. (f) The binding of IgG1 to the EphA2 receptors on A549 cells at different concentrations. (g) Changes in the mean fluorescence intensity of scFv-Fc when bound to EphA2 receptors on A549 cells at different concentrations. (h) Changes in the mean fluorescence intensity of IgG1 when bound to EphA2 receptors present on A549 cells at different concentrations (the data are representative of one of three independent experiments)
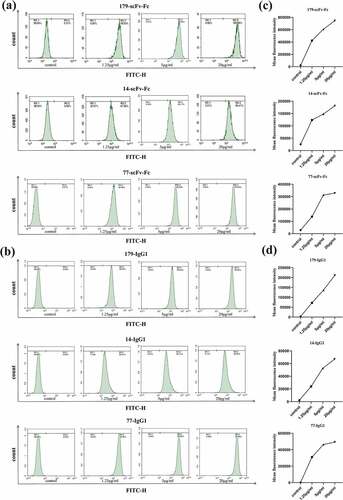
Figure 6. Continued
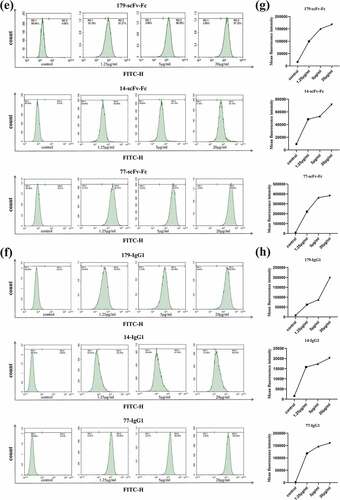
Figure 7. The bivalent recombinant scFv-Fc antibody and full-length IgG1 antibody bind effectively to EphA2 receptors on the surface of tumor tissues. (a) The binding of scFv-Fc to adenocarcinoma tissue and adjacent normal lung tissue. The isotype controls are background staining controls. (b) The binding of IgG1 to adenocarcinoma tissue and adjacent normal lung tissue. The isotype controls are background staining controls (magnification: 40×; scale bar: 40 μm)
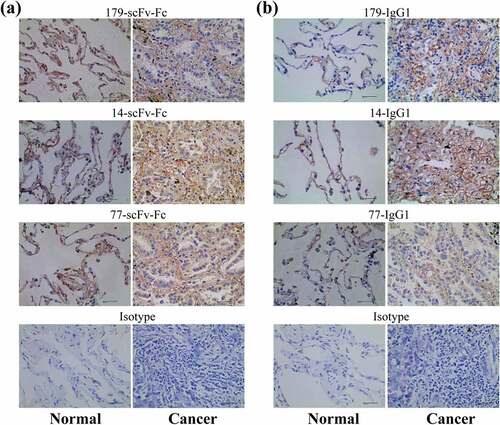
Figure 8. Both the bivalent recombinant scFv-Fc antibody and full-length IgG1 antibody inhibited the growth of tumor cells to some extent. (a) Inhibition of tumor cell growth by scFv-Fc at different concentrations and various durations of action. (b) Inhibition of tumor cell growth by IgG1 at different concentrations and durations of action (n ≥ 3 per experimental group; ns, not statistically significant; * P < 0.05; ** P < 0.01; and *** P < 0.001. A t-test for group design was used for statistical analysis