
Figures & data
Table 1. Primer for MSP-PCR
Figure 1. DNA methylation in asthma. (a) The distribution of differential methylation sites on chromosomes; (b) Frequency of hypermethylation and hypomethylation on each chromosome; (c) Clustering heat map of methylation difference sites
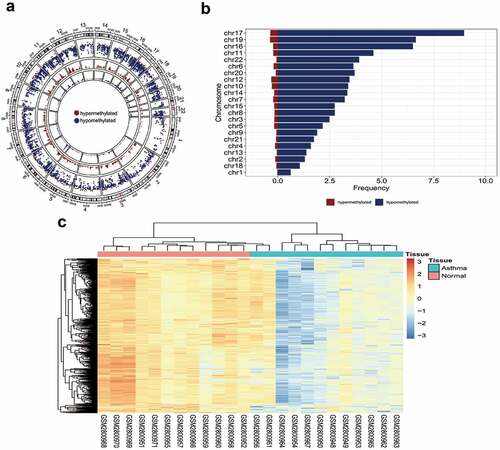
Table 2. Distribution of methylation on each chromosome
Figure 2. Differential genes in asthma. (a) Volcano map of differential genes; (b) The relationship between DNA methylation differences and expression of differential genes. The blue dots indicate that the fold change of gene expression was greater than 2, and the average difference of methylation sites was greater than 0.3. The red dots indicate the sites with statistical differences
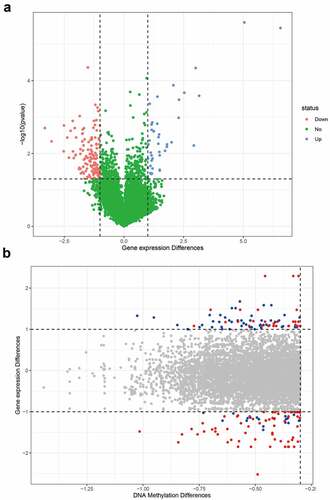
Figure 3. Analysis of the correlation between DNA methylation sites and gene expression. (a) Cumulative ratio of gene expression variation; (b) Beta size histogram distribution; (c) Interpreted histogram distribution of gene expression variation
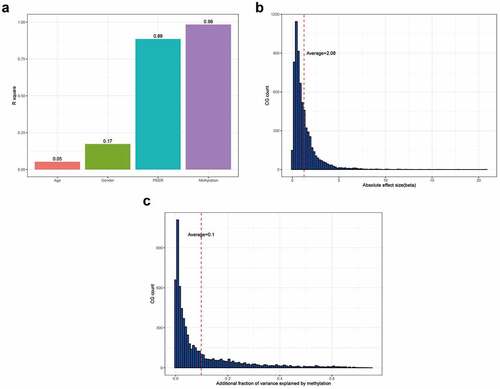
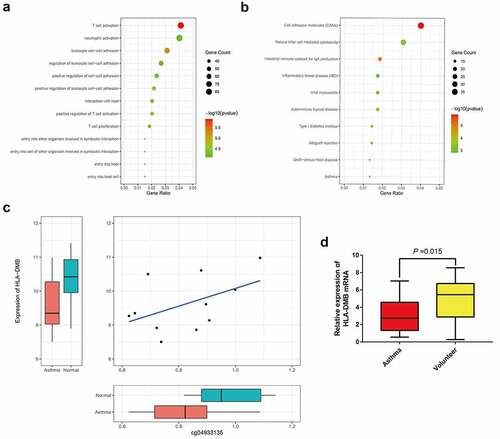
Figure 4. GO annotation and KEGG analysis. (a) Gene function annotation analysis; (b) KEGG pathway analysis; (c) Expression correlation between cg04933135 and HLA-DMB; (d) The expression level of HLA-DMB mRNA was detected in the blood samples of asthma patients and healthy volunteers by RT-qPCR
Supplemental Material
Download JPEG Image (1.2 MB)
Data availability statement
The data used to support the findings of this study are available from the corresponding author ([email protected]) upon request.