Figures & data
Table 1. The flow distribution simulation in porous mediums
Figure 1. Schematic diagram of experimental unit (seven sampling points: No. 1, No. 2, No. 3, No. 4, No. 5, No. 6, No. 7)
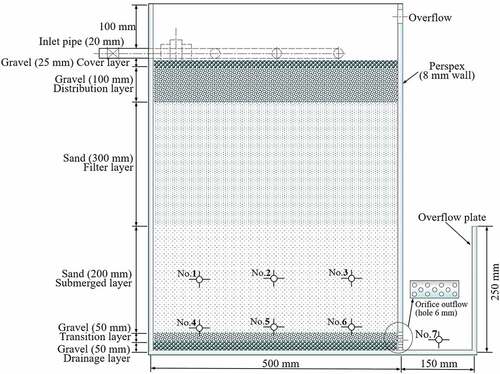
Table 2. Geometric parameters and simulation parameters of the layered bioretention model
Figure 2. Static pressure in BRC under: (a) 0.5 m3/m2·d of hydraulic loading rate, (b) 1.0 m3/m2·d of hydraulic loading rate, (c) 1.5 m3/m2·d of hydraulic loading rate, and (d) 2.0 m3/m2·d of hydraulic loading rate
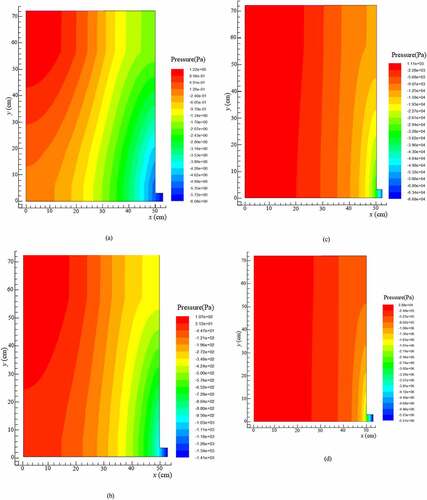
Figure 3. Velocity vectors in BRC under: (a) 0.5 m3/m2·d of hydraulic loading rate, (b) 1.0 m3/m2·d of hydraulic loading rate, (c) 1.5 m3/m2·d of hydraulic loading rate, and (d) 2.0 m3/m2·d of hydraulic loading rate
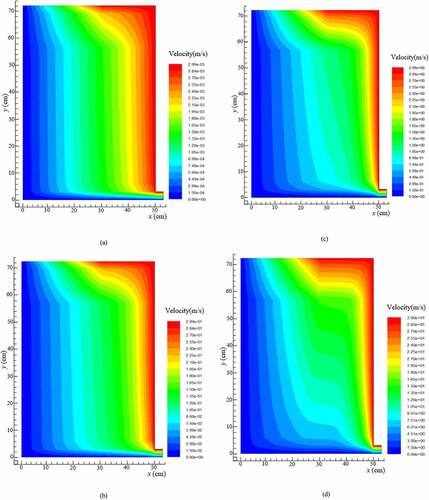
Figure 4. Retention time density distribution curves at different hydraulic loading rates for: (a) sampling point No. 1, (b) sampling point No. 2, (c) sampling point No. 3, (d) sampling point No. 4, (e) sampling point No. 5, (f) sampling point No. 6, and (g) sampling point No. 7
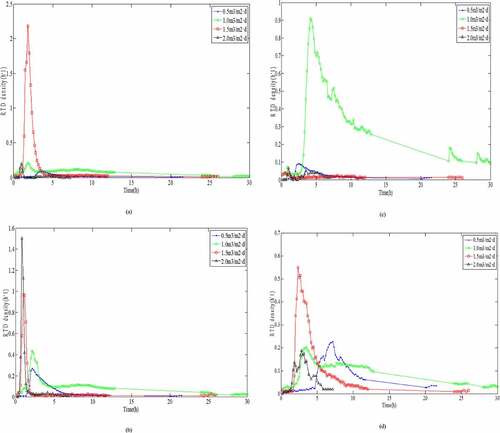
Figure 4. Continued
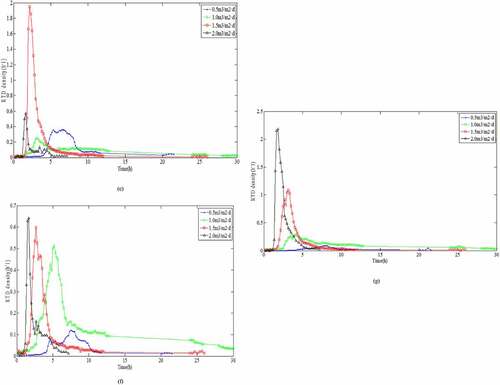
Figure 5. Retention time density distribution curves for different hydraulic loading rates : (a) 0.5 m3/m2·d; (b) 1.0 m3/m2·d; (c) 1.5 m3/m2·d; and (d) 2.0 m3/m2·d
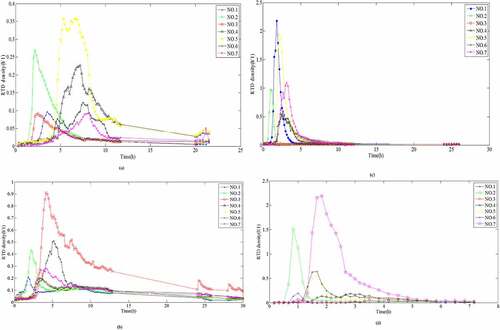
Table 3. Estimated hydraulic parameters based on impulse tracer test data
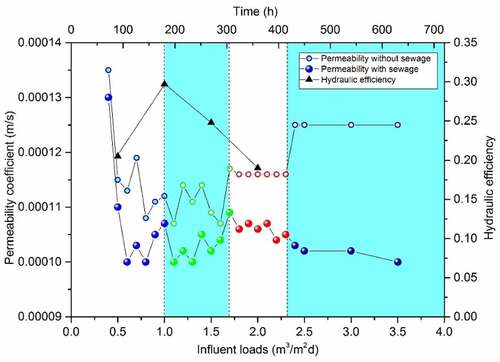
Figure 6. Correlation between permeability, hydraulic efficiency and hydraulic loads