Figures & data
Figure1. Effect of electroacupuncture on endometrial thickness of rats during estrous cycle. (a) Vaginal secretions in rats were detected by HE staining. (b) Efficacies of different-frequency electroacupuncture treatment on rats’ endometrial thickness. Data are represented as mean ± SD (n ≥ 3 experiments). *p < 0.05, **p < 0.01, ***p < 0.001 and ****p < 0.0001 as determined using Student’s t-test (two groups) or one-way ANOVA, followed by Tukey’s test (more than two groups)
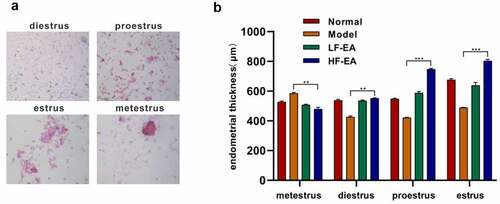
Figure 2. Effect of electroacupuncture on endometrial membrane capacitance in rats. (a) The pinopodes of endometrial epithelial cells were observed with electron microscopy. (b) Amount of blastocyst implantation in rats was calculated by observing the uterus of each group. Data are represented as mean ± SD (n ≥ 3 experiments). *p < 0.05, **p < 0.01, ***p < 0.001 and ****p < 0.0001 as determined using Student’s t-test (two groups) or one-way ANOVA, followed by Tukey’s test (more than two groups)
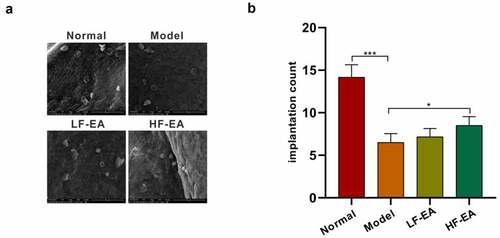
Figure 3. Expressions of Claudin, E-cadherin and β-catenin in rat endometrium were detected by immunofluorescence. (a) The levels of E-cadherin in endometrium of rats were detected by immunofluorescence. (b) Expressions of β-catenin in endometrium of rats were detected by immunofluorescence. (c) Expressions of CLDN1 in endometrium of rats were detected by immunofluorescence. Data are represented as mean ± SD (n ≥ 3 experiments). *p < 0.05, **p < 0.01, ***p < 0.001 and ****p < 0.0001 as determined using Student’s t-test (two groups) or one-way ANOVA, followed by Tukey’s test (more than two groups)
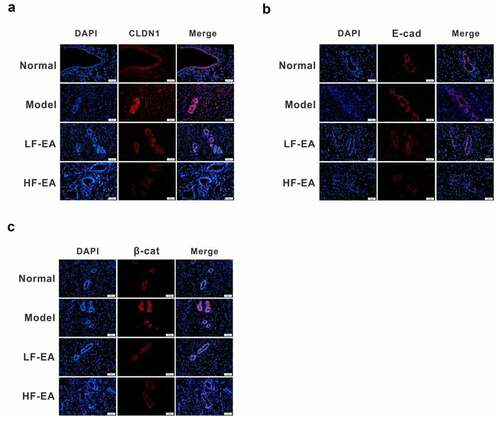
Figure 4. Electroacupuncture inhibited the expressions of E-cadherin, β-catenin and CLDN1 in the endometrium of rats. (a) Expressions of E-cadherin, β-catenin and CLDN1 in rats’ endometrium of each group were measured with Western bolt. (b) Protein quantitative map of E-cadherin in endometrium of rats in each group. (c) Quantitative protein mapping of β-catenin in endometrium of rats in each group. (d) Quantitative graph of CLDN1 protein in endometrium of rats
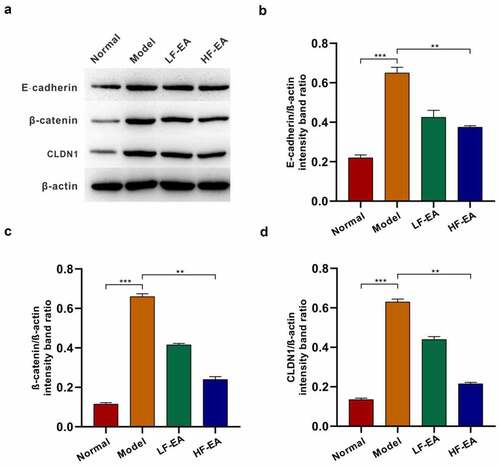
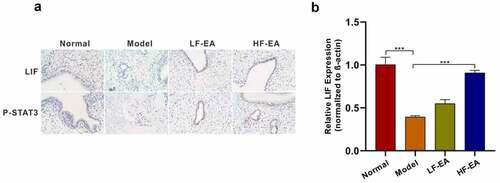
Figure 5. Electroacupuncture increased levels of LIF/ STAT3 signaling pathway. (a) Both LIF and P-STAT3 expressions in rat endometrium were detected with immunohistochemical. (b) LIF expression in rat endometrium was detected with qPCR. Data are represented as mean ± SD (n ≥ 3 experiments). *p < 0.05, **p < 0.01, ***p < 0.001, and ****p < 0.0001 as determined using Student’s t-test (two groups) or one-way ANOVA, followed by Tukey’s test (more than two groups)