Figures & data
Figure 1. RFT alleviates the inflammation of LPS-treated IEC-6 cells. (a) The cell viability, (b) inflammatory factors and (c) inflammation-related protein expression was respectively measured by CCK-8, RT-qPCR and western blot in LPS-treated IEC-6 cells under RFT challenge. All experimental data are represented as mean ± SD. ***P < 0.001 versus control, #p < 0.05, ##p < 0.01, ### p < 0.001 versus LPS
Figure 2. RFT reduces the intestinal cytotoxicity in LPS-treated IEC-6 cells. (a) The levels of LDH, (b) DAO and (c) I-FABP were measured to indicate the changes of intestinal cytotoxicity. The experimental data are shown as mean ± SD.***P < 0.001 versus control, ##p < 0.01, ### p < 0.001 versus LPS
Figure 3. RFT alleviates the apoptosis of LPS-treated IEC-6 cells. The apoptosis of LPS-treated IEC-6 cells treated with was measured by (a) TUNEL and (b) western blot. The experimental data are shown as mean ± SD. ***P < 0.001 versus control, #p < 0.05, ##p < 0.01, ### p < 0.001 versus LPS
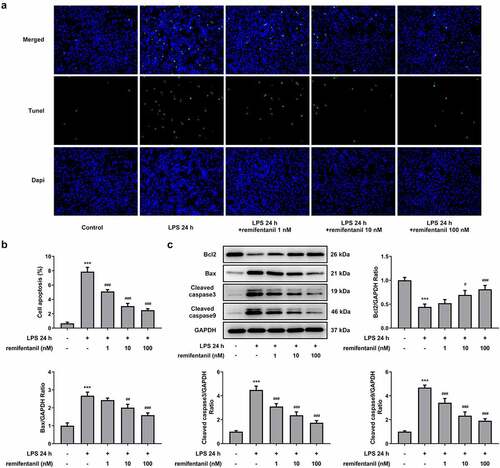
Figure 4. RFT activates the autophagy of LPS-induced IEC-6 cells. (a) The expression of autophagy-related proteins and (b) that of LC3II/LC3I was measured in LPS-induced IEC-6 cells. The experimental data are displayed as mean ± SD. *P < 0.05, ***P < 0.001 versus control. ##p < 0.01, ### p < 0.001 versus LPS
Figure 5. Inhibiting autophagy blocks the ability of RFT to alleviate LPS-induced IEC-6 cell inflammation. (a) The cell viability, (b) inflammatory factors and (c) inflammation-related protein expression was respectively measured by CCK-8, RT-qPCR and western blot in LPS-treated IEC-6 cells under RFT and 3-MA challenge. The experimental data are displayed as mean ± SD. ***P < 0.001 versus control. ### p < 0.001 versus LPS. ΔΔp<0.01, ΔΔΔp<0.001 versus LPS+ remifentanil
Figure 6. Inhibiting autophagy blocks the ability of RFT to alleviate LPS-induced IEC-6 cell cytotoxicity. (a) The levels of LDH, (b) DAO and (c) I-FABP were measured to indicate the changes of intestinal cytotoxicity. The experimental data are displayed as mean ± SD. ***P < 0.001 versus control. ### p < 0.001 versus LPS. ΔΔp<0.01, ΔΔΔp<0.001 versus LPS+ remifentanil
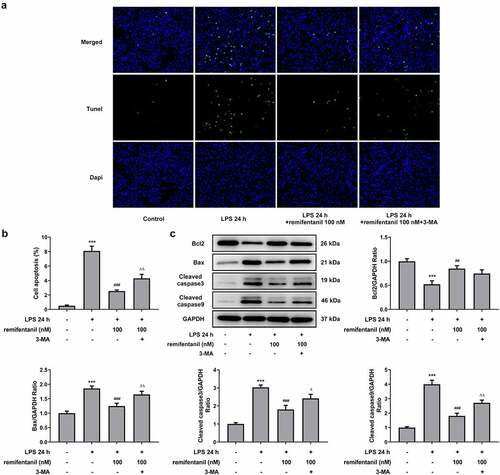
Figure 7. Inhibiting autophagy blocks the ability of RFT to alleviate LPS-induced IEC-6 cell apoptosis. (a) The expression of autophagy-related proteins and (b) that of LC3II/LC3I was measured in LPS-induced IEC-6 cells. The experimental data are indicated as mean ± SD. ***P < 0.001 versus control. ## p < 0.01, ### p < 0.001 versus LPS. Δp<0.05, ΔΔp<0.01 versus LPS+ remifentanil