
Figures & data
Figure 1. The effect of Omarigliptin on cell viability of MC3T3‑E1 cells. Cells were treated with Omarigliptin at varying concentrations (0, 1, 5, 10, 20, 100, 500 μM) for 14 days, (a) the cell viability and (b) LDH release were determined (*, **, P < 0.05, 0.01 vs. vehicle group, n = 5–6)
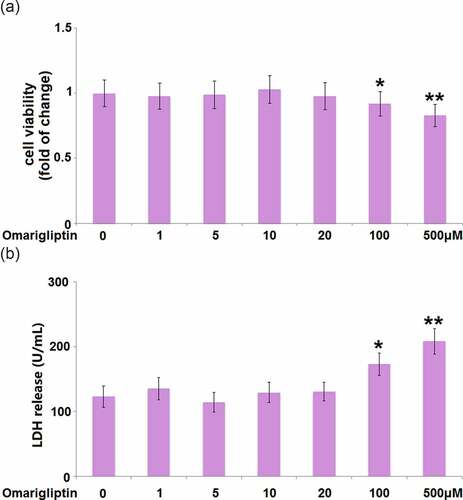
Figure 2. The effect of Omarigliptin on ALP activity and mineralization in MC3T3‑E1 cells. Cells were cultured with osteogenic medium (OM) and Omarigliptin (20 μM) for 14 days. (a) The Alp activity; (b) Alizarin Red S staining assay in MC3T3-E1 cells. Scale bar, 200 μm (****, P < 0.0001 vs. vehicle group; ###, P < 0.001 vs. OM treatment group, n = 6)
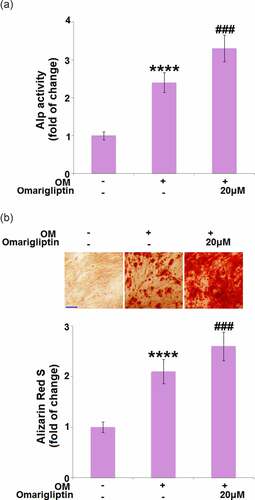
Figure 3. The effect of Omarigliptin on the expressions of BMP-2, Ocn, and ALP in MC3T3‑E1 cells. The cells were cultured with osteogenic medium (OM) and Omarigliptin (20 μM). (a) The mRNA BMP-2, Ocn, and ALP; (b) The Protein expression level of BMP-2, Ocn, and ALP (****, P < 0.0001 vs. vehicle group; ###, P < 0.001 vs. OM treatment group, n = 5–6)
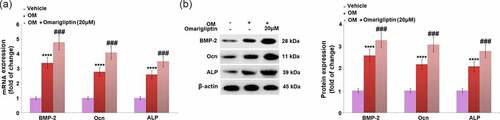
Figure 4. The effect of Omarigliptin on the expressions of Col1a1 and Col1a2 in MC3T3‑E1 cells. The cells were cultured with osteogenic medium (OM) and Omarigliptin (20 μM). The mRNA level of Col1a1 and Col1a2 (****, P < 0.0001 vs. vehicle group; ###, P < 0.001 vs. OM treatment group, n = 5–6)
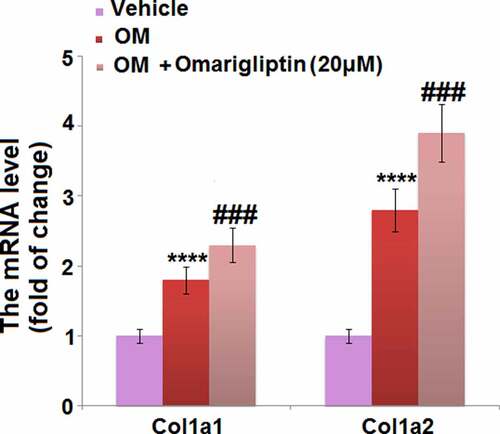
Figure 5. The effect of Omarigliptin on the expressions of RUNX-2, SP7, Fgfr2, and Fgfr3 in MC3T3‑E1 cells. The cells were cultured with osteogenic medium (OM) and Omarigliptin (20 μM). (a) The mRNA expression levels of RUNX-2, Sp7, Fgfr2, and Fgfr3; (b) The protein level of RUNX-2, Sp7, Fgfr2, and Fgfr3 (****, P < 0.0001 vs. vehicle group; ###, P < 0.001 vs. OM treatment group, n = 5–6)
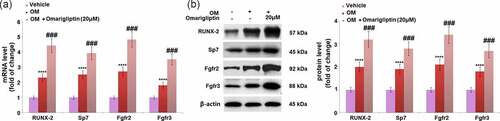
Figure 6. The MAP kinase p38 and Akt signaling pathways were involved in Omarigliptin-induced osteogenic differentiation in MC3T3‑E1 cells. The cells were cultured with osteogenic medium (OM) and Omarigliptin (20 μM). Western blots of p-p38 and p-Akt (****, P < 0.0001 vs. vehicle group; ###, P < 0.001 vs. OM treatment group, n = 5–6)
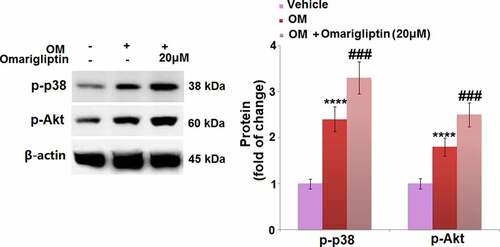
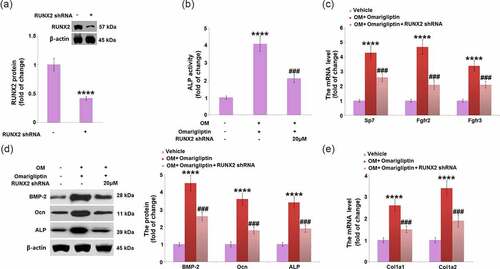
Figure 7. RunX2 was involved in Omarigliptin-induced osteoblastic differentiation in MC3T3‑E1 cells. The cells were infected by lentiviral-RUNX2 shRNA or control shRNA and then treated with osteogenic medium (OM) and 20 μM Omarigliptin. (a). RUNX2 protein level was determined; (b) The Alp activity; (c) The mRNA level of Sp7, Fgfr2, and Fgfr3; (d) The mRNA level of BMP-2, Ocn, ALP; (e) The mRNA level of Col1a1 and Col1a2 (****, P < 0.0001 vs. vehicle group; ###, P < 0.001 vs. OM+ Omarigliptin group, n = 5–6)
Data availability statement
Requests for data and materials should be addressed to the corresponding author.