Figures & data
Figure 1. DEX relieves HT-22 cell dysfunction induced by H/R treatment. (a) Relative cell viability after H/R injury and DEX treatment was measured using CCK-8 assay. (b) Cell apoptosis rate after H/R injury and DEX treatment was measured by flow cytometry. (c-e) TNF-α (d), IL-6 (e), and IL-1β (f) levels were measured by ELISA. *P < 0.05; **P < 0.01; ***P < 0.001
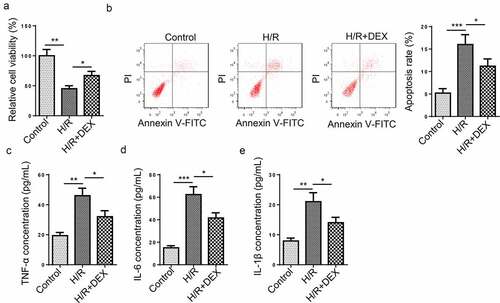
Figure 2. Circ-CDR1as is down-regulated after DEX treatment and reverses the effects of DEX on H/R-treated HT-22 cell proliferation, apoptosis, and inflammation. (a) Circ-CDR1as expression in HT-22 cells after H/R injury and DEX treatment was detected via RT-qPCR. (b) Circ-CDR1as overexpression efficiency was evaluated by RT-qPCR. (c) Circ-CDR1as expression in Control group, H/R group, H/R+ DEX group, H/R+ DEX+Vector group, or H/R+ DEX+oe-circ-CDR1as group was evaluated by RT-qPCR. (d) cell viability was measured using CCK-8 assay. (e) Cell apoptosis rate after H/R injury and DEX treatment was measured by flow cytometry. (f-h) TNF-α (g), IL-6 (h), and IL-1β (i) levels were measured by ELISA. *P < 0.05; **P < 0.01; ***P < 0.001
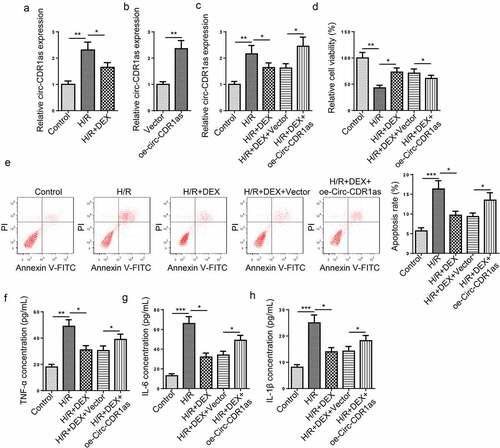
Figure 3. MiR-28-3p directly binds to circ-CDR1as. (a) Binding site between circ-CDR1as and miR-28-3p. (b) MiR-28-3p overexpression efficiency was evaluated by RT-qPCR. (c) The binding relationship between circ-CDR1as and miR-28-3p was verified by dual-luciferase activity assay. (d) MiR-28-3p expression in HT-22 cells after H/R injury and DEX treatment was detected via RT-qPCR. (e) Circ-CDR1as knockdown efficiency was evaluated by RT-qPCR. (f) MiR-28-3p expression in HT-22 cells transfected with Vector, oe-circ-CDR1as, si-NC, or si-circ-CDR1as was detected by RT-qPCR. *P < 0.05; **P < 0.01; ***P < 0.001
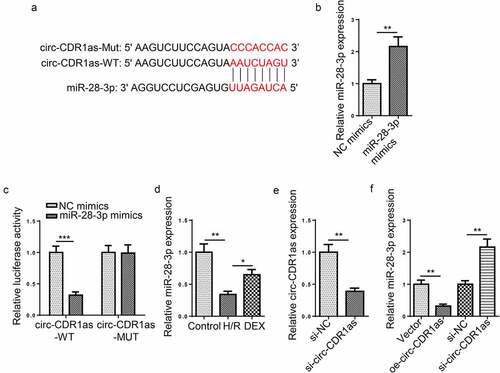
Figure 4. Circ-CDR1as expedited apoptosis and inflammatory responses of H/R-treated HT-22 cells via regulating miR-28-3p. (a) HT-22 cells were subject to H/R treatment and then transfected with Vector, oe-circ-CDR1as, oe-circ-CDR1as+NC mimics, or oe-circ-CDR1as+miR-28-3p mimics, with untreated HT-22 cells as the Control group. MiR-28-3p expression in each group was evaluated by RT-qPCR. (b) cell viability was measured using CCK-8 assay. (c) Cell apoptosis rate after H/R injury and DEX treatment was measured by flow cytometry. (d-f) TNF-α (e), IL-6 (f), and IL-1β (g) levels were measured by ELISA. *P < 0.05; **P < 0.01
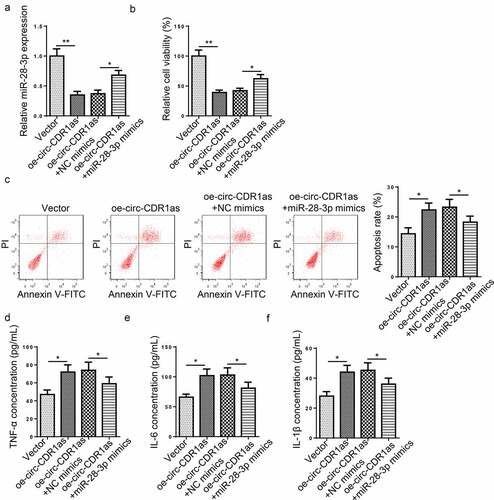
Figure 5. MiR-28-3p targets TRAF3. (a) Venn diagram of target mRNAs for miR-28-3p predicted by 5 databases (microT, miRmap, PITA, PicTar, and TargetScan). (b) Binding site between TRAF3 and miR-28-3p. (c) The binding relationship between TRAF3 and miR-28-3p was verified by dual-luciferase activity assay. (d) TRAF3 expression in HT-22 cells after H/R injury and DEX treatment were detected via RT-qPCR. (e) MiR-28-3p knockdown efficiency was evaluated by RT-qPCR. (f) TRAF3 expression in HT-22 cells transfected with NC mimics, miR-28-3p mimics, miR-28-3p mimics+Vector, or miR-28-3p mimics+oe-circ-CDR1as were detected by RT-qPC. (g) TRAF3 expression in HT-22 cells transfected with NC inhibitor, miR-28-3p inhibitor, miR-28-3p inhibitor+si-NC, or miR-28-3p inhibitor+si-circ-CDR1as were detected by RT-qPCR. *P < 0.05; **P < 0.01; ***P < 0.001
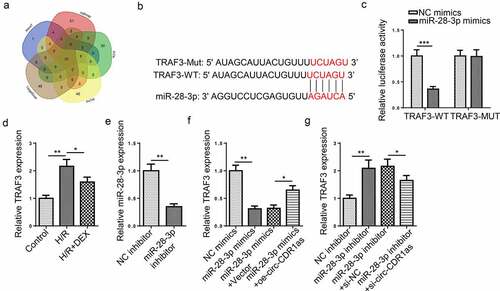
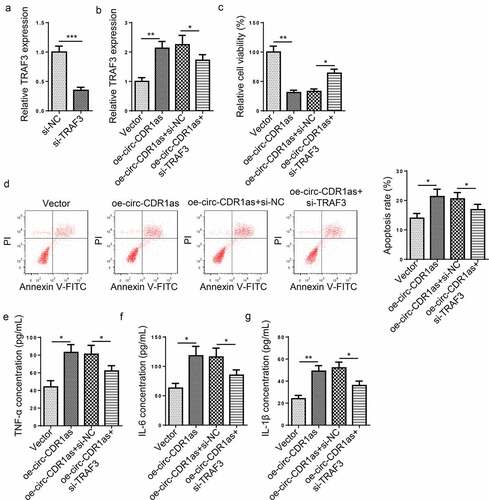
Figure 6. TRAF3 knockdown reverses the effect of circ-CDR1as overexpression on H/R-challenged HT-22 cells. (a) TRAF3 knockdown efficiency was evaluated by RT-qPCR. (b) HT-22 cells were subject to H/R treatment and then transfected with Vector, oe-circ-CDR1as, oe-circ-CDR1as+si-NC, and oe-circ-CDR1as+si-TRAF3, with untreated HT-22 cells as the Control group. TRAF3 mRNA and protein levels in HT-22 cells from each group were detected by RT-qPCR. (c) cell viability was measured using CCK-8 assay. (d) Cell apoptosis rate after H/R injury and DEX treatment was measured by flow cytometry. (e-g) TNF-α (f), IL-6 (g), and IL-1β (h) levels were measured by ELISA. *P < 0.05; **P < 0.01; ***P < 0.001