Figures & data
Figure 1. The visualization of differential gene expression profile (a) A volcano plot of the expression of DEGs in the whole gene profile, significantly upregulated genes are indicated in red, downregulated in green (b) Cluster pattern of Heat map concerning DEGs, high level expressions are indicated in red, low level in blue
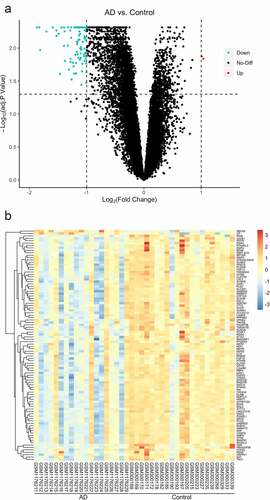
Figure 2. GO and KEGG pathway enrichment results of DEGs: (a) cellular component, (b) molecular function, (c) biological process, (d) KEGG pathways
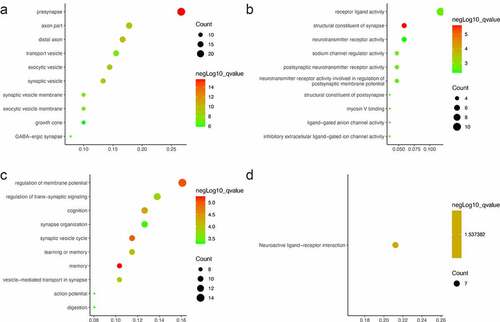
Figure 3. PPI network and GO/KEGG pathway enrichment results of genes in the cluster (a) DEGs in Protein-protein interaction network. Nodes in red represent upregulated genes and nodes in blue represent downregulated genes, the internal circle indicates the cluster (b) cellular component, (c) molecular function (d) biological process, (e) KEGG pathway
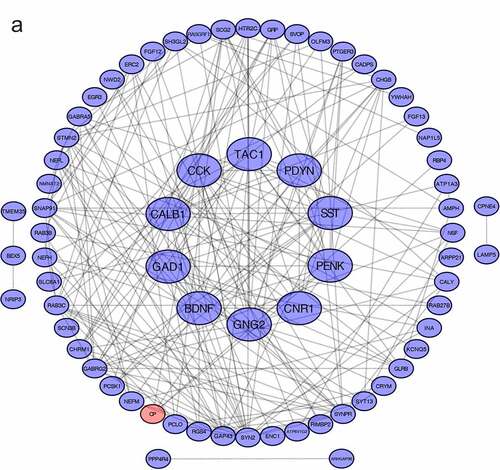
Figure 3. Continued
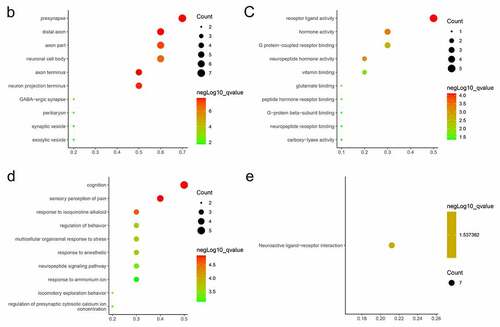
Table 1. Top 20 genes and the intersection in the cytoHubba. MCC, Maximal Clique Centrality. DMNC, Density of Maximum Neighborhood Component. MNC, Maximum Neighborhood Component
Figure 4. Venn diagrams for identification of hub genes (a) 10 hub genes were identified via the intersection of four algorithms (b) 4 genes related to the cognition according to biological process of Gene Ontology database. CALB1, Calbindin 1. TAC1, Tachykinin precursor 1. CCK, cholecystokinin. CNR1, cannabinoid receptor type 1
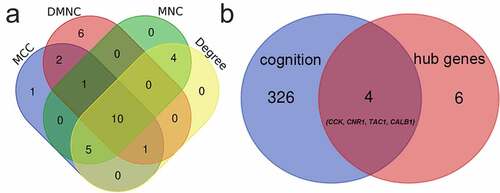
Figure 5. Validation of APP/PS1 mice. A. APP/PS1 mice spent more time finding the platform than wildtype mice in training phase, Day1(60 ± 0 vs 47.90 ± 10.86, P = 0.038), Day2(57.90 ± 6.50 vs 35.56 ± 12.48, P = 0.009), Day3(56.48 ± 6.30 vs 28.30 ± 9.20, P < 0.0001), Day4(49.54 ± 6.92 vs 22.38 ± 5.35, P < 0.0001), Day5(49.17 ± 10.06 vs 16.46 ± 8.94, P = 0.001). B. In probe test, the number of crossing removed platform location declined in APP/PS1 mice (P = 0.018) C. In probe test, the time stayed in the platform quadrant declined in APP/PS1 mice (P = 0.011)
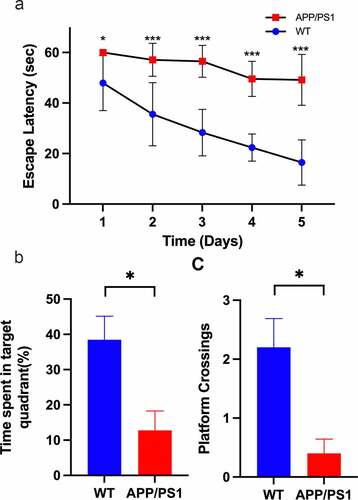
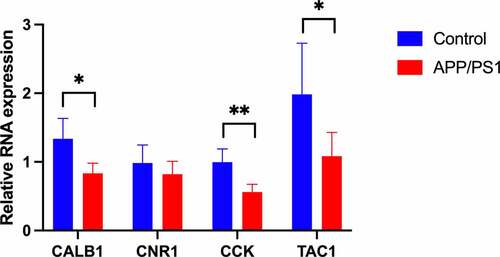
Figure 6. mRNA expression of four hub genes in two groups. CALB1, CCK, TAC1 showed a significant difference between the two groups. CALB1(P = 0.01), TAC1(P = 0.039), CCK (P = 0.02), CNR1 (P = 0.29)