Figures & data
Figure 1. Amelioration of CIRI via Sev in vivo. (a) Neurological impairment score; (b-d) Inflammation factors TNF-α, IL-1β and IL-6 in rat brain tissue detected via ELISA; (e-g) the content of oxidative stress indexes MDA, SOD, GSH-Px in rat brain tissue detected via ELISA; (h) He staining to observe the pathological damage of brain tissue; (i) TTC staining images to evaluate the cerebral infarction area in each group, and the quantified relative infarct rate to evaluate the effect of SEV on MCAO-induced brain injury; (j) TUNEL staining to detect the apoptosis of brain tissue. (a) n = 12; b-j, n = 6; The data were expressed as mean ± SD; * vs. the Sham, P < 0.05; # vs. the MCAO, P < 0.05
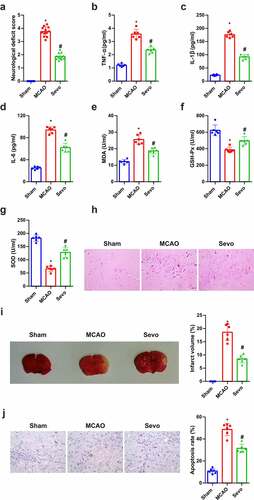
Figure 2. SEV has a protective influence on Ogd/ R-induced HT22 cell damage. (a-c) TNF-α, IL-1β and IL-6 in HT22 cells detected by ELISA; (d-f) MDA, SOD, GSH-Px in HT22 cells detected via ELISA; (g) ROS detection in HT22 cells; (h) Cell viability detection via CCK-8; (i) Cell proliferation detected by plate cloning; (j) Transwell to detect cell migration and invasion; (k) Flow cytometry detection of apoptosis. n = 3; The data were expressed as mean ± SD; * vs. the Ctrl, P < 0.05; # vs. the Ogd/R, P < 0.05
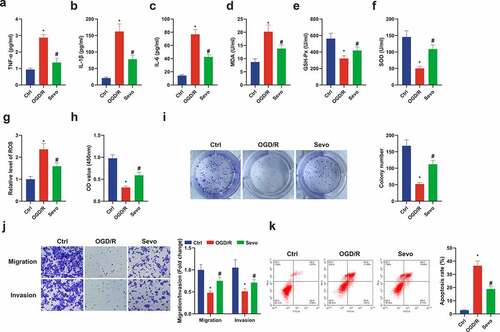
Figure 3. SEV controls miR-30 c-5p and HIPK1 in vitro and vivo models of CIRI. (a) Apparent decline of miR-30 c-5p in vivo model of CIRI, while restoration of miR-30 c-5p via SEV; (b-c) Clear elevation of HIPK1 in vivo model of CIRI, while silence of HIPK1 via SEV; (d) Obvious depression of miR-30 c-5p in vitro Ogd/R model, while elevation via Sev; (e-f) Up-regulation of HIPK1 in vitro Ogd/R model, while silence via SEV; (a-c) n = 6, (d-f) n = 3; The data were expressed as mean ± SD; * vs. the Sham, P < 0.05; # vs. the MCAO, P < 0.05; + vs. the Ctrl, P < 0.05; $ vs. the Ogd/R, P < 0.05
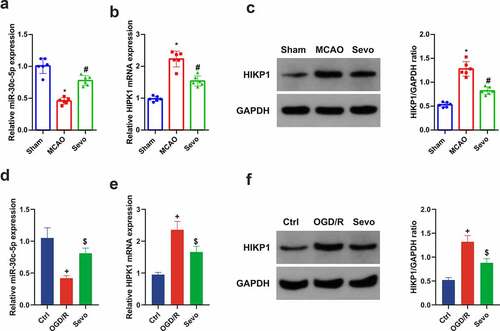
Figure 4. Knockdown miR-30 c-5p can remove the protection of SEV in vivo. (a) After injection of miR-30 c-5p antagonist, the qPCR detection of miR-30 c-5p in rat brain tissue; (b) Neurological impairment score; (c-e) TNF-α, IL-1β and IL-6 in rat brain tissue detected by ELISA; (f-h) MDA, SOD and Gsh-Px in rat brain tissue detected by ELISA; (i) He staining to observe the pathological damage of brain tissue; (j) TTC staining images to evaluate the cerebral infarction area in each group of rats, and the quantified relative infarct rate to evaluate the effect of repressive miR-30 c-5p on MCAO-induced brain injury; (k) TUNEL staining to detect the apoptosis of brain tissue. (b) n = 12; (a) & (c-k), n = 6; The data were expressed as mean ± SD; * vs. the SEV + antagomir nc, P < 0.05
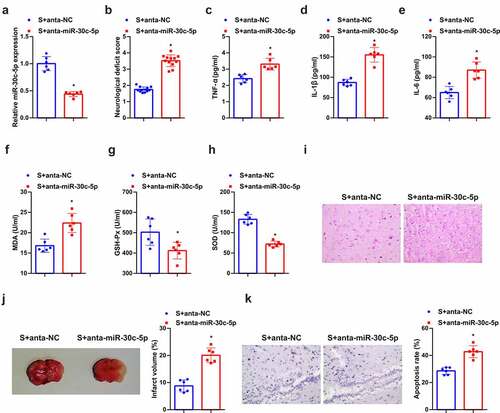
Figure 5. Knockdown miR-30 c-5p can remove the protection of SEV in vitro. (a) After transfection with miR-30 c-5p inhibitor, the qPCR detection of miR-30 c-5p in HT22 cells; (b-d) TNF-α, IL-1β and IL-6 in HT22 cells detected by ELISA; (e-g) MDA, SOD and Gsh-Px in HT22 cells detected by ELISA; (h) ROS detection in HT22 cells; (i) Cell viability detection via CCK-8; (j) Cell proliferation detected by plate cloning; (k) Transwell to detect cell migration and invasion; (l) Flow cytometry detection of apoptosis. n = 3; The data were expressed as mean ± SD; * vs. the S + in-NC, P < 0.05
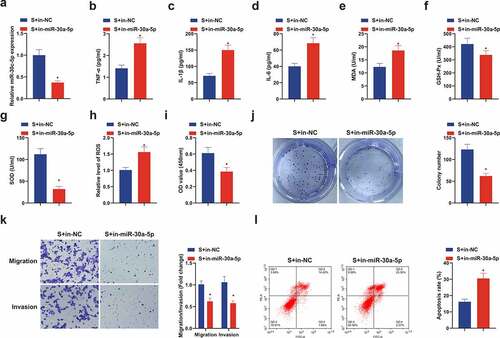
Figure 6. miR-30 c-5p in vitro targets HIPK1 and negatively controls its expression. (a) Through bioinformatics analysis forecasted the binding site of miR-30 c-5p with HIPK1 (http://starbase.sysu.edu.cn/); (b) In HT22 cells transfected with miR-30 c-5p mimic, the combination of miR-30 c-5p and HIPK1 verified by luciferase reporter gene assay; (c) RT-qPCR detection of HIPK1 in cells introduced with in-miR-30 c-5p; (d) Western blot detection of HIPK1 in cells introduced with in-miR-30 c-5p; n = 3; The data were expressed as mean ± SD; * vs. the miR-Nc, P < 0.05; + vs. the S + in-NC, P < 0.05
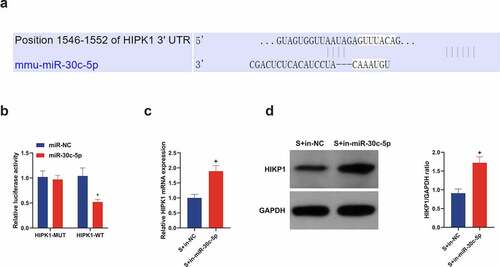
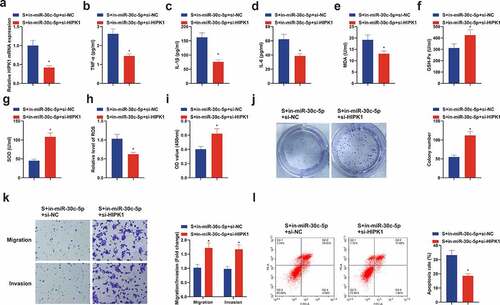
Figure 7. Repressive HIPK1 reverses the effect of reduced miR-30 c-5p on CIRI in vitro. (a) After transfection of si-HIPK1, the qPCR detection of HIPK1 in HT22 cells; (b-d) TNf-α, Il-1β and IL-6 in HT22 cells detected by ELISA; (e-g) MDA, SOD and GSH-Px in HT22 cells detected by ELISA; (h) ROS detection in HT22 cells; (i) Cell viability detection via CCK-8; (j) Cell proliferation detected by plate cloning; (k) Cell migration and invasion detection via Transwell; (l) Flow cytometry detection of apoptosis. n = 3; The data were expressed as mean ± SD; * vs. the S + in-miR-30 c-5p + si-NC, P < 0.05