Figures & data
Figure 1. LncRNA SNHG7 silencing reduced cell viability and increased the protein levels of p53 and PTEN. (a) The expression of lncRNA SNHG7 in SKOV3, HeyA8, SKOV3-PTX and HeyA8-PTX cells was detected by RT-qPCR. ***P < 0.001 versus SKOV3, ###P < 0.001 versus HeyA8. (b) The interference plasmid of lncRNA SNHG7 was constructed, and the expression of lncRNA SNHG7 was detected by RT-qPCR. ***P < 0.001 versus siRNA-NC. (c) Cell viability was detected by CCK8 and OD value was calculated. ***P < 0.001 versus siRNA-NC. (d) The expressions of P53 and PTEN were detected by Western blot. ***P < 0.001 versus siRNA-NC
Figure 2. After interference by siRNA-SNHG7, the invasion and migration of SKOV3-PTX and HEYA8-PTX cells were inhibited. (a-b) The invasiveness and migration of cells were detected by Transwell assay and Wound healing assay. ***P < 0.001 versus siRNA-NC. (c-d) Total cell lysates were immunoblotted with MMP2 or MMP9 antibodies. ***P < 0.001 versus siRNA-NC
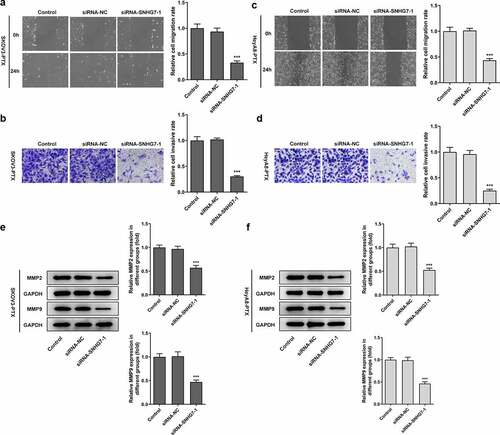
Figure 3. Silencing of lncRNA SNHG7 in PTX-resistant ovarian cancer cells leads to enhanced the sensitivity of SKOV3-PTX or heyA8-PTX to PTX and promotes G1 arrest. (a-b) CCK8 assay was performed. (c-d) Flow cytometry was performed to detect cell cycle. **P < 0.01, ***P < 0.001 versus siRNA-NC
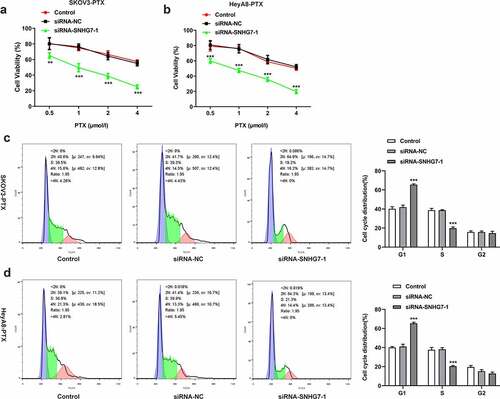
Figure 4. LncRNA SNHG7 interacted with EIF4G2 and lncRNA SNHG7 silencing reduced EIF4G2 levels. (a) A schematic of the putative interacting sites of lncRNA SNHG7 and EIF4G2. (b) Western blot and Quantitative real-time RT-PCR (qPCR) were performed to determine the expression of EIF4G2 in SKOV3, SKOV3-PTX, HeyA8 and HeyA8-PTX cells. ***P < 0.001 versus SKOV3, ###P < 0.001 versus HeyA8. (c) RIP assay was performed to analyze the interaction of lncRNA SNHG7 and EIF4G2. ***P < 0.001 versus IgG (d-e) qPCR was performed to determine the expression of EIF4G2. **P < 0.01, ***P < 0.001 versus siRNA-NC
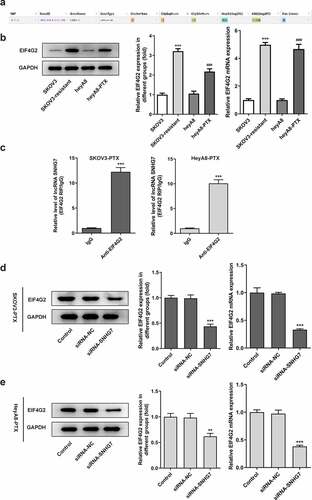
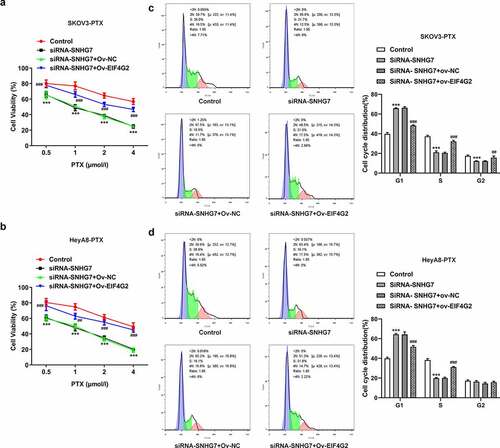
Figure 5. LncRNA SNHG7/EIF4G2 interaction affected viability and the protein levels of SKOV3-PTX or HEYA8-PTX cells. (a) cell viability was detected by CCK8 assay kit. ***P < 0.001 versus siRNA-SNHG7+ Ov-NC. (b-c) Total cell lysates were immunoblotted with p53 or PTEN antibodies. ***P < 0.001 versus Control, ##P < 0.01, ###P < 0.001 versus siRNA-SNHG7+ Ov-NC
Figure 6. LncRNA SNHG7/EIF4G2 interaction affected invasion and migration of paclitaxel-resistant ovarian cancer cells. (a-b) The migration and invasion of cells were detected by Transwell and Wound healing assay, respectively, as described in the Materials and Methods. (c-d) The expression of MMP2 and 9 was analyzed through western blot assay. ***P < 0.001 versus Control, #P < 0.05, ##P < 0.01, ###P < 0.001 versus siRNA-SNHG7+ Ov-NC
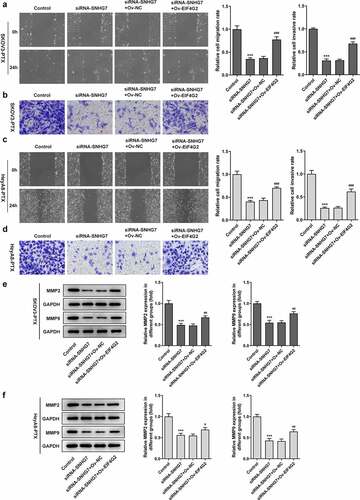
Figure 7. LncRNA SNHG7/EIF4G2 interaction affected cell viability and G1 arrest. (a-b) The cell activity was detected by CCK8 assay in SKOV3-PTX or HEYA8-PTX cells. (c-d) Flow cytometry was used to analyze the cell cycle. **P < 0.001 versus Control, ##P < 0.01, ###P < 0.001 versus siRNA-SNHG7+ Ov-NC