
Figures & data
Figure 1. CNVs and mutations analysis of genome loci in BLCA. (a) The significantly amplified fragments (red) in BLCA genome were shown. (b) The significant deleted fragments (blue) in BLCA were shown. The rows are arranged according to the genome loci. (c) Distribution of mutations in 32 genes with significant mutation frequencies on basis of training dataset. Upper bar graph showed the total number of non-synonymous and synonymous mutations of 32 genes in each patient. And right histogram showed the number of clinical samples with mutations in each gene among the 32 genes
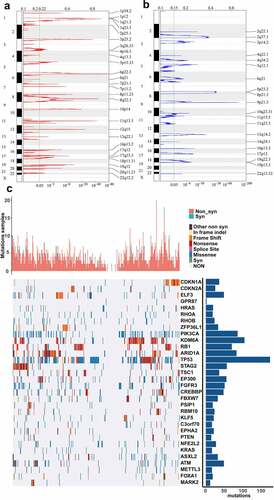
Figure 2. Construction and evaluation of the lncRNA signature based on multi-omics data. (a) Venn diagram about lncRNAs associated with genomic CNVs, gene mutation or BLCA recurrence. (b) The change trajectory of every independent variable. Horizontal axis represents the log value of independent variable lambda, and vertical axis represents the coefficient of independent variable. (c) Confidence intervals under each lambda. (d) Distribution of risk score, RFS and lncRNA expression of each case. (e) ROC curve analysis base on ten‐lncRNA signature. (f) Kaplan-Meier RFS curve analysis
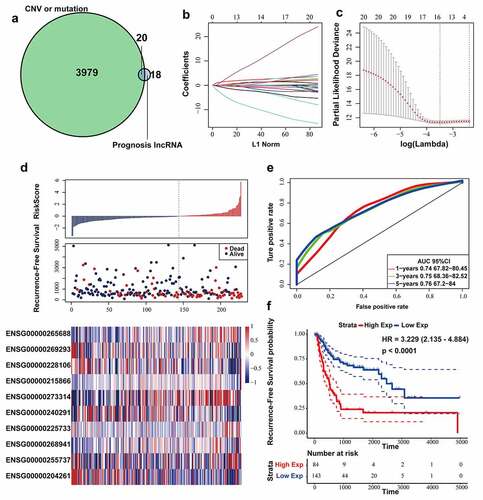
Figure 3. Evaluating the prognostic power of ten-lncRNA signature in the testing datasets. (a) Distribution of risk score, RFS and lncRNA expression of each case in the entire TCGA dataset. (b) ROC curve analysis of ten-lncRNA signature in the entire TCGA dataset. (c) Kaplan-Meier RFS curve analysis of high and low relapse‐risk sets in the entire TCGA dataset. (d) Distribution of risk score, RFS and lncRNA expression of every patient in GSE31684 dataset. (e) ROC curve analysis of ten-lncRNA signature in GSE31684 dataset. (f) Kaplan-Meier RFS curve of high and low relapse‐risk groups according to ten-lncRNA signature in GSE31684 dataset
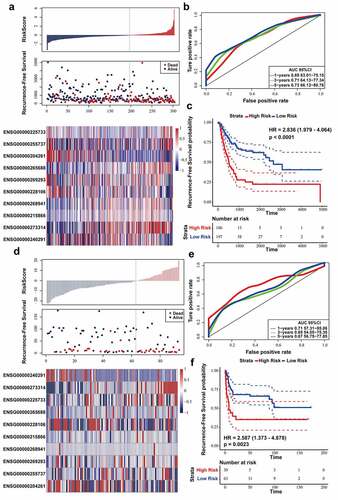
Figure 4. Stratified analysis on the basis of age, stage or subtype. (a,b) Kaplan-Meier RFS curve analysis in the younger or elderly dataset. (c,d) Kaplan-Meier RFS curve analysis in Stage III or Stage IV cohorts. (e,f) Kaplan-Meier RFS curve analysis in the non-papillary or papillary dataset. (g) Results of GSEA analysis in the TCGA training dataset
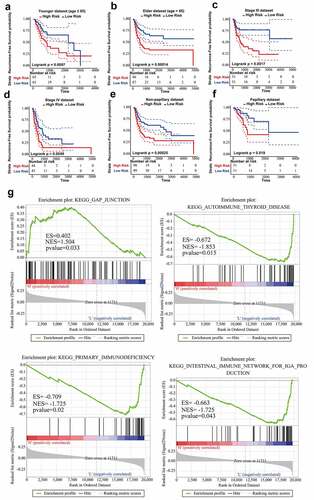
Figure 5. The analysis on the tumor immune microenvironment characteristics. (a) Evaluation of the correlation between the abundance of diverse immune cells and the ten-lncRNA signature via the CIBERSORT algorithm. (b) Evaluating the correlation between tumor microenvironment and the ten-lncRNA signature via the ESTIMATE algorithm
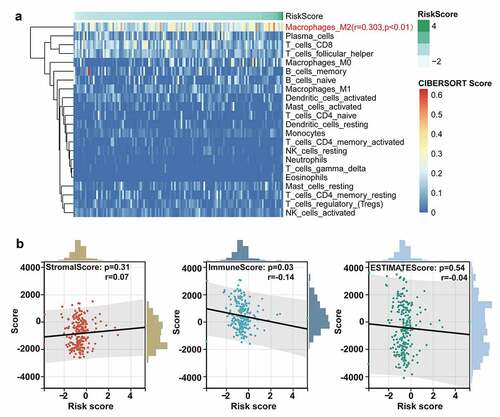
Figure 6. Comparing ten-lncRNA signature with two reported lncRNA signatures in BLCA. (a) ROC curve analysis and Kaplan-Meier RFS curve analysis on the reported 6-lncRNA signature in the TCGA training dataset. (b) ROC curve analysis and Kaplan-Meier RFS curve analysis on the reported 4-lncRNA signature in the TCGA training dataset
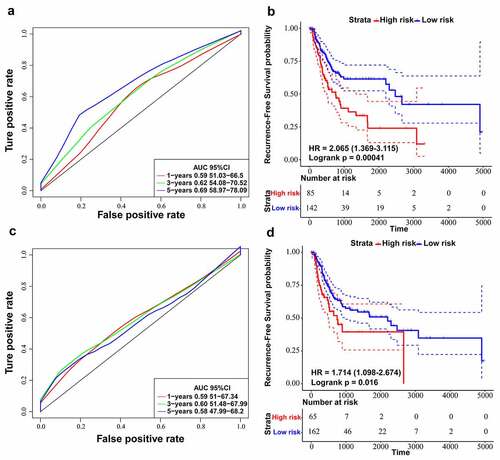
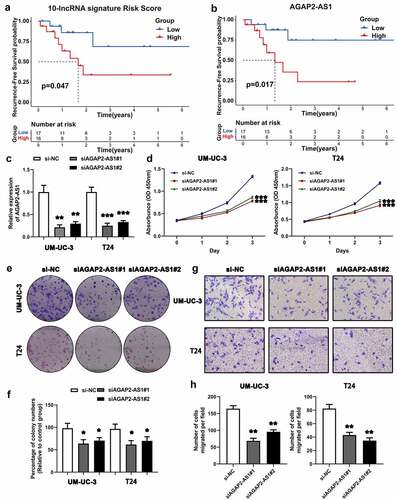
Figure 7. Survival analysis of the ten-lncRNA signature in BLCA samples and experimental study on the biofunction of AGAP2-AS1 on the BLCA cells. (a) Kaplan-Meier RFS curve analysis on the ten-lncRNA signature in the 33 BLCA samples. (b) Kaplan-Meier RFS curve analysis on the expression of AGAP2-AS1 in the 33 BLCA samples. (c) Evaluating the efficiency of AGAP2-AS1 knockdown via qRT-PCR. (d) CCK-8 assay on the effect of AGAP2-AS1 knockdown on cell proliferation. The OD value among different groups was found to be significantly different by two-way ANOVA. *p < 0.05; **p < 0.01; ***p < 0.001. The data are expressed as the mean ± SD. (e, f) Colony formation assay on the BLCA cells transfected with siRNA. (g, h) Transwell assay was used to evaluate the migration of BLCA cells transfected with siRNA
Supplemental Material
Download Zip (2.3 MB)Data availability statement
Original data were uploaded to a recognized data repository (URL: https://zenodo.org/record/5153530#.YZtEZU5ByUk; DOI: 10.5281/zenodo.5153530)