
Figures & data
Figure 1. Cytotoxicity of Rotigotine in HUVECs. HUVECs were stimulated with 0.1, 0.2, 1, 2, 10, 20, and 100 μM Rotigotine for 24 hours. (a). Molecular structure of Rotigotine; (b). Cell viability (†, ††, †††, P < 0.01, 0.001, 0.0001 vs. vehicle group, N = 5–6)
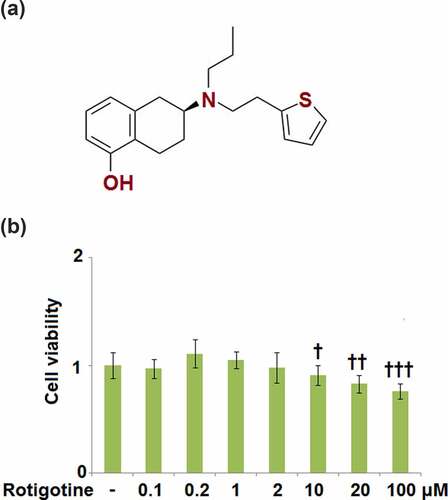
Figure 2. Treatment with Rotigotine reduced ox-LDL-induced expressions of PCSK-9, SREBP-2, and LDL-R in HUVECs. Cells were stimulated with ox-LDL (100 μg/mL) in the inclusion or exclusion of 1 and 2 μM Rotigotine for 24 hours. (a). mRNA of PCSK-9; (b). mRNA of SREBP-2; (c). mRNA of LDL-R; (d). Protein of PCSK-9, SREBP-2, LDL-R (†††, P < 0.0001 vs. vehicle group; ǂ, ǂǂ, P < 0.01, 0.001 vs. ox-LDL group, N = 6)
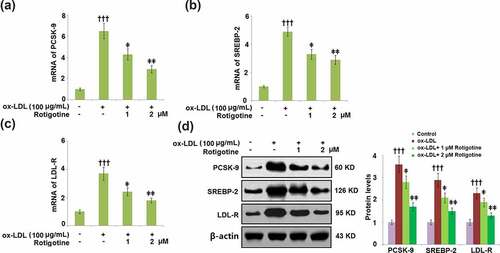
Figure 3. Rotigotine decreases ox-LDL-induced total cholesterol and free cholesterol deposition in HUVECs. Cells were stimulated with ox-LDL (100 μg/mL) in the inclusion or exclusion of 1, and 2 μM Rotigotine for 24 hours. (a). Total cholesterol (TC); (b). Free cholesterol (†††, P < 0.0001 vs. vehicle group; ǂ, ǂǂ, P < 0.01, 0.001 vs. ox-LDL group, N = 5–6)
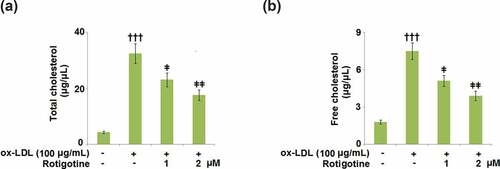
Figure 4. Treatment with Rotigotine attenuated ox-LDL-induced oxidative stress in HUVECs. (a). Levels of ROS were measured using DHE staining; (b). m RNA expression of NOX-4; (c). Protein of NOX-4 (†††, P < 0.0001 vs. vehicle group; ǂ, ǂǂ, P < 0.01, 0.001 vs. ox-LDL group, N = 5–6)
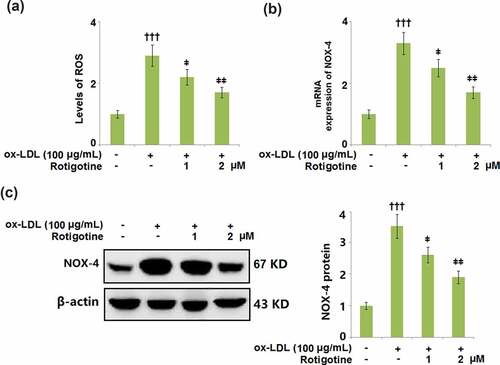
Figure 5. Rotigotine inhibited the expression of pro-inflammatory cytokines in HUVECs. (a). TNF-α mRNA; (b). IL-8 mRNA; (c). MCP-1 mRNA; (d). TNF-α secretion as measured with ELISA; (e). IL-8 secretion as measured with ELISA; (f). MCP-1 secretion as measured with ELISA (†††, P < 0.0001 vs. vehicle group; ǂ, ǂǂ, P < 0.01, 0.001 vs. ox-LDL group, N = 5–6)
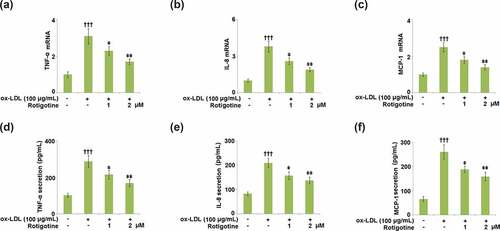
Figure 6. Rotigotine suppressed the expression of cell adhesion molecules in HUVECs. (a). VCAM-1 mRNA; (b). ICAM-1 mRNA; (c). VCAM-1 protein as measured with ELISA; (d). ICAM-1 protein as measured by ELISA (†††, P < 0.0001 vs. vehicle group; ǂ, ǂǂ, P < 0.01, 0.001 vs. ox-LDL group, N = 5–6)
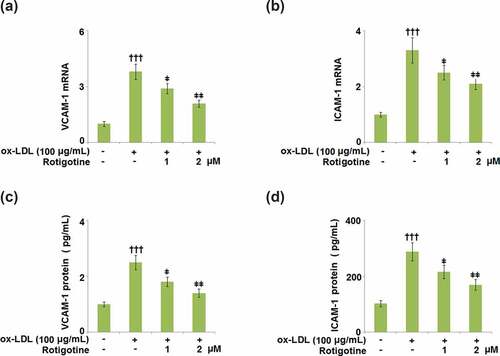
Figure 7. Rotigotine ameliorated ox-LDL- induced attachment of monocytes to HUVECs. Attachment of U937 monocytes to HUVECs was measured using 5-chloromethylfluorescein diacetate (CMFDA) staining (†††, P < 0.0001 vs. vehicle group; ǂ, ǂǂ, P < 0.01, 0.001 vs. ox-LDL group, N = 5–6)
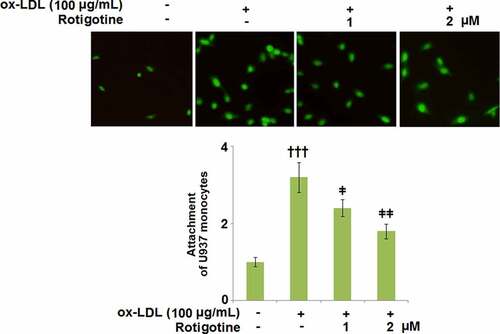
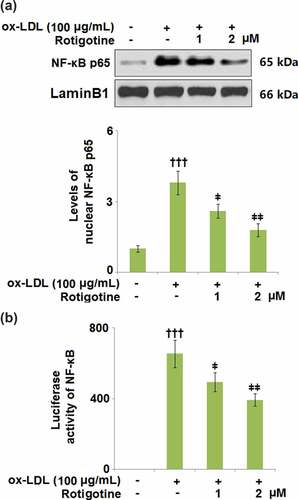
Figure 8. Rotigotine inhibited activation of NF-κB. (a). Levels of nuclear NF-κB p65; (b). Luciferase activity of NF-κB (†††, P < 0.0001 vs. vehicle group; ǂ, ǂǂ, P < 0.01, 0.001 vs. ox-LDL group, N = 5–6)
Supplemental Material
Download Zip (64.8 KB)Data availability statement
Data of this study are available upon reasonable request to the corresponding authors.