Figures & data
Table 1. Clinical characteristics of 12 samples (six JAK2V617F-positive cMPNs patients and six normal controls), from which bone marrow mononuclear cells were isolated
Table 2. Primers for qRT-PCR for validation of the expression of DEGs
Table 3. Primers for qRT-PCR for validation of the expression of DELs
Table 4. Top 20 dysregulated mRNAs detected using microarray assays
Table 5. Top 20 dysregulated LncRNAs detected using microarray assays
Figure 1. The lncRNA and mRNA expression profiles of 12 samples (six JAK2V617F-positive cMPNs patients and six JAK2V617F-negative normal controls). (a) Expression of mRNA between JAK2V617F-positive cMPNs patients and JAK2V617F-negative normal controls. (b) Expression of lncRNA between JAK2V617F mutation-positive MPN patients and mutation-negative controls. (c) Microarray data of differently expressed genes. (d) Validation of the expression of differently expressed genes by qRT-PCR. (e) Microarray data of differently expressed lncRNAs. (f) Validation of the expression of differently expressed lncRNAs by qRT-PCR. (g) Transcription levels of ITGB3 in myeloid leukemia cell lines. (h) Translation levels of ITGB3 in myeloid leukemia cell lines. (*P < 0.05; ****P < 0.0001)
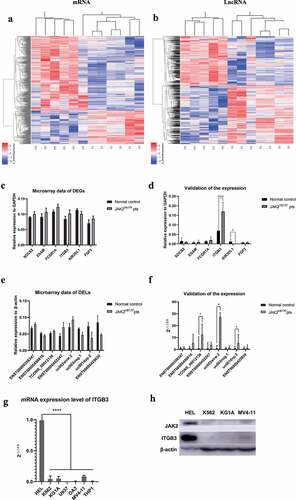
Figure 2. Co-expressed mRNAs heatmaps of differential expressed-lncRNAs. (a) lncRNA_ENST00000414065_cluster, (b) lncRNA_ENST00000427852_cluster, (c) lncRNA_ENST00000561476_cluster, (d) lncRNA_NR_023926_cluster
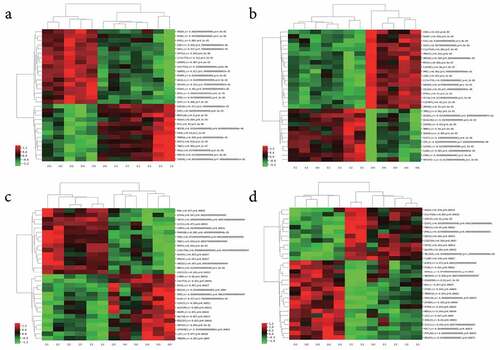
Figure 3. GO enrichment analysis of differentially expressed genes. (a) and (b) GO enrichment results of up-regulated differentially expressed genes (DEGs). (c) and (d) GO enrichment results of down-regulated DEGs. (e) and (f) GO enrichment results of all DEGs. In the bubble chart, the size of the dot represents the number of genes, and the color of the dot represents the p-value
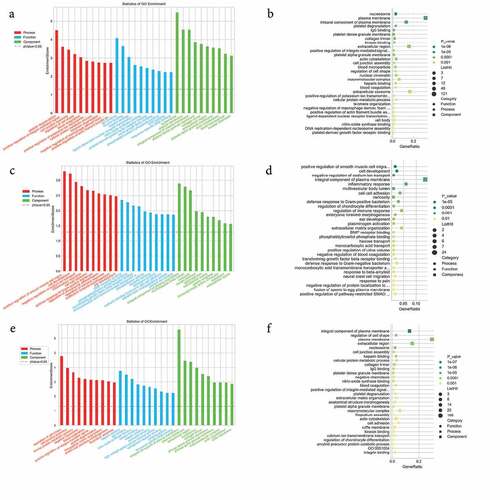
Figure 4. KEGG pathway analysis of differentially expressed genes. (a) KEGG enrichment results of up-regulated and (b) down-regulated differentially expressed genes
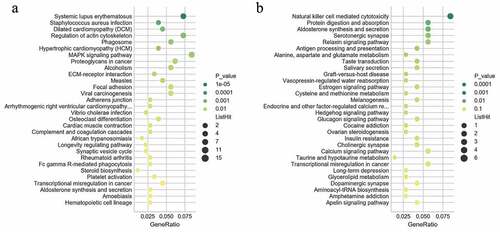
Figure 5. GO and KEGG terms analysis of co-expressed coding genes associated with differentially expressed lncRNAs. The bar demonstrates the degree of enrichment, which was calculated by the following formula: (The number of selected genes in a term/total number of selected genes)/ (the total number of genes in a term of the database/the total number of genes in the database). (a) Biological process; (b) Cellular component; (c) Molecular function; (d) KEGG pathways
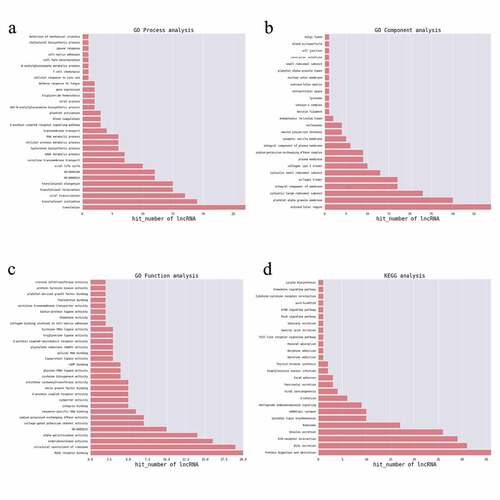
Figure 6. LncRNA Cis-regulation analysis. (a) ENST00000356347 cis-regulates ZNF141; (b) ENST00000456816 cis-results CPN2; (c) hsa-mir-449c cis-results DHX29; (d) NR_026874 cis-results NOC2L; (e) TCONS_00012136 cis-results MAS1L; (f) uc003lqp.2 cis-results AFAP1L1. The red line indicates the genomic position of the mRNA having a positive regulatory relationship with the lncRNA; the green line indicates the genomic position of the mRNA having a negative regulatory relationship with the lncRNA; The blue colored lines mark the genomic position of lncRNAs, and the ordinate is the Pearson’s correlation coefficient between the mRNA and the lncRNA
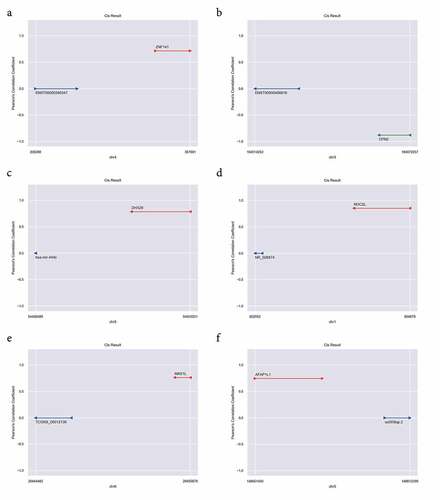
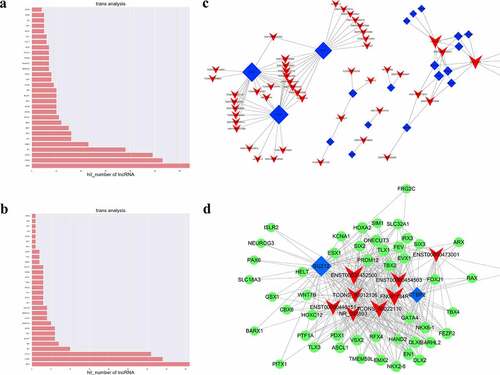
Figure 7. LncRNAs and transcription factor correlation analysis. (a) GO terms enriched in the TFs which significantly associated with DE lncRNAs; (b) KEGG pathways enriched in the TFs which significantly associated with DE lncRNAs; (c) LncRNA-TF pairs enriched in the study; (d) LncRNA-TF relationship pairs and their targeted-differential genes identified the three-element network correlation among lncRNA-TFs-target genes in cMPNs