
Figures & data
Table 1. Clinical information of enrolled 12 individuals in the WES analysis
Figure 1. Three pSS pedigrees examined in this study
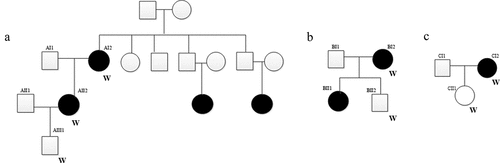
Table 2. Common mutation genes between pedigree A, B, and C
Figure 2. Number and functional analysis of mutant genes in pedigree A
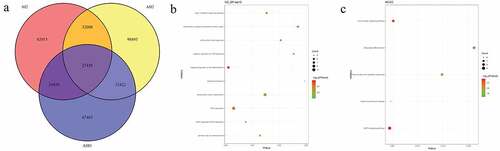
Figure 3. Number and functional analysis of mutant genes in pedigree B
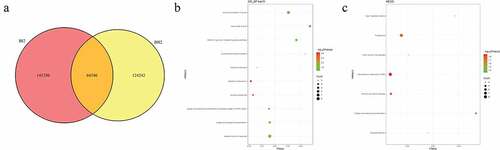
Figure 4. Number and functional analysis of mutant genes in pedigree C
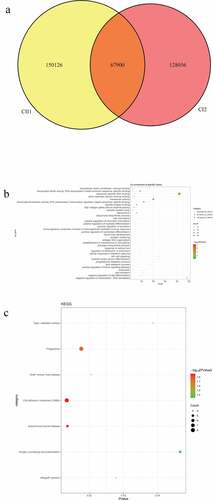
Table 3. Mutation information of FCGBP, ANKRD36C, and FRG2C in the sporadic cases
Figure 5. Common mutations and PPI analysis of mutant genes in 5 sporadic cases
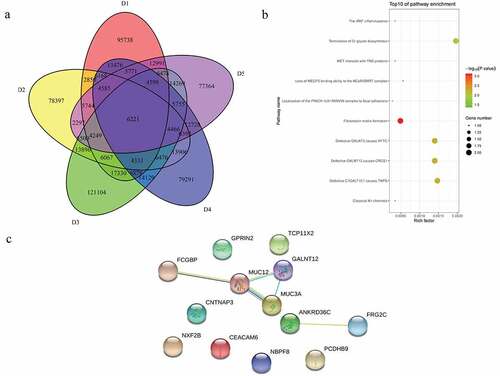
Table 4. Common mutation genes in family patients and sporadic patients
Table 5. Partial pathogenic genes in the CNV deletion regions and involved systemic lupus erythematosus signaling pathway in family A
Table 6. Partial pathogenic genes in the CNV deletion regions in family B
Figure 6. Pathogenic CNVs and functional analysis of involving genes in pedigree A
Figure 7. Pathogenic CNVs and functional analysis of involving genes in pedigree B
Figure 8. Pathogenic CNVs and functional analysis of involving genes in pedigree C
Figure 9. Venn diagrams of pathogenic CNVs in 5 sporadic cases
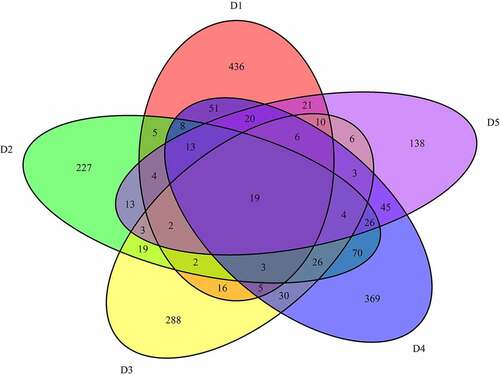
Table 7. 3 GEO datasets of gene expression in pSS
Table 8. CNVs amplification/deletion of 51 immune related genes in 3 pedigrees
Table 9. CNVs amplification/deletion of 51 immune related genes in 5 sporadic cases
Figure 10. GSEA enrichment pathways of differentially expressed genes in both GSE66795 dataset and GSE84844 dataset
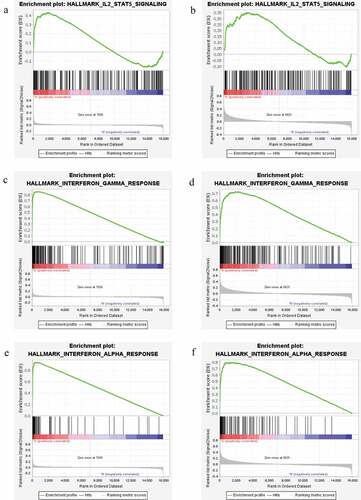
Figure 11. Sanger validation results of ZNF180 variant in 4 patients in 3 pedigrees and 2 sporadic patients. Red base represents the mutation site
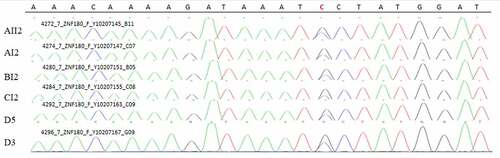
Figure 12. Sanger validation results of FCGBP variant in 4 patients in 3 pedigrees and 5 sporadic patients. Red base represents the mutation site
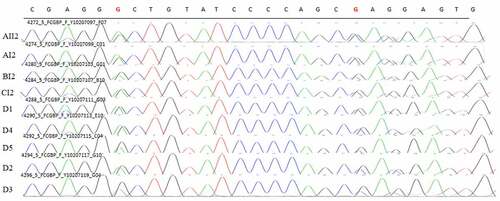
Figure 13. Sanger validation results of FRG2C variant in 4 patients in 3 pedigrees and 5 sporadic patients. Red base represents the mutation site
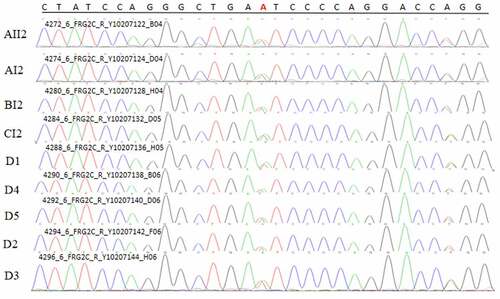
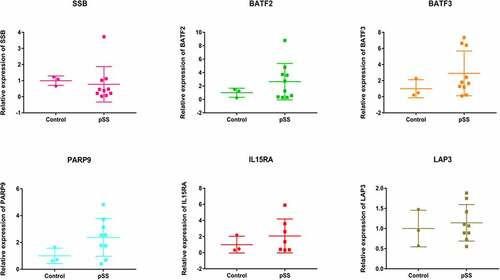
Figure 14. The in vitro validation of SSB, BATF2, BATF3, PARP9, IL15RA, and LAP3 in pSS
Supplemental Material
Download MS Excel (19.9 KB)Data availability statement
All data are available in the article.