Figures & data
Figure 1. Display of the layering results of the cytocentrifuge tube. (a) the cell layering before centrifugation; (b) the cell layering after centrifugation).
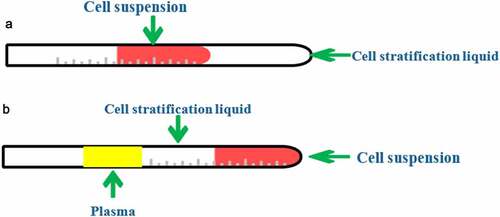
Figure 2. Observation of cell morphology under microscope. (a) preliminarily isolated mononuclear cell; (b) EPCs cell after three days of culture; (c) EPCs cells cultured for five days; (d) EPCs cells cultured for eight days (100×); (e) EPCs cells cultured for eight days (200×).
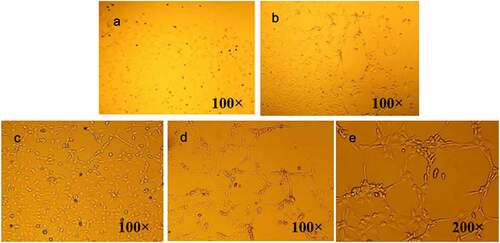
Figure 3. Cell fluorescence double staining observation. (A: Dil-acLDL staining; B: FITC-UEA-I staining; C: double staining).
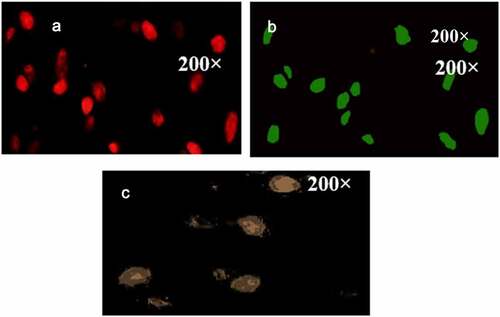
Figure 4. Flow cytometry detection result of EPCs surface marker CD133.
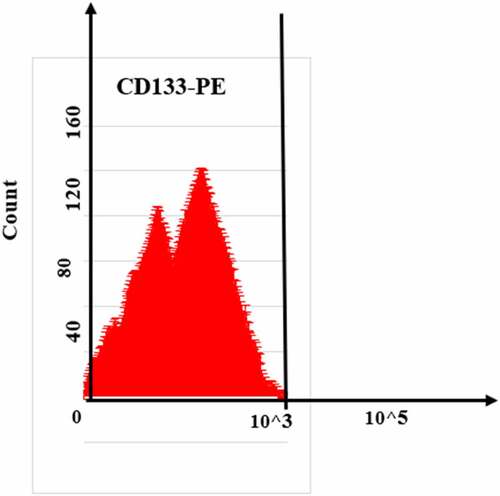
Figure 5. Flow cytometry detection result of EPCs surface marker CD34.
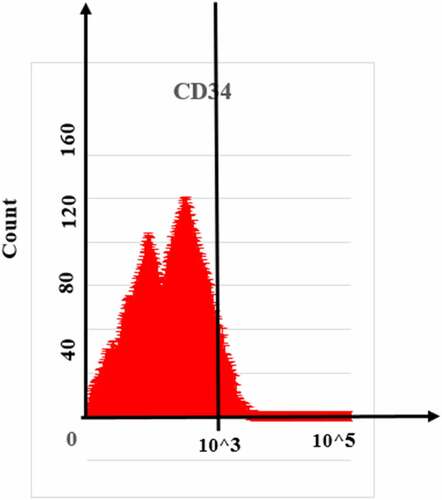
Figure 6. Flow cytometry detection result of EPCs surface marker KDR.
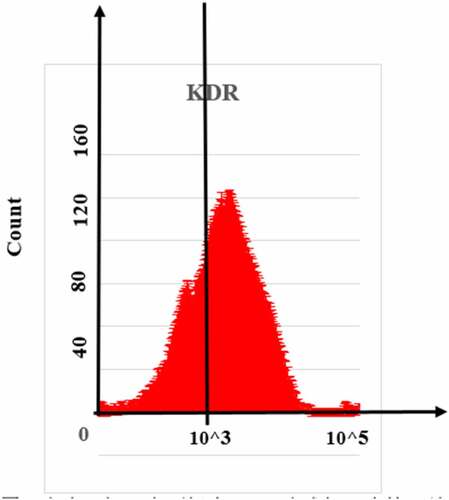
Figure 7. Comparison of basic data of the two groups of patients.
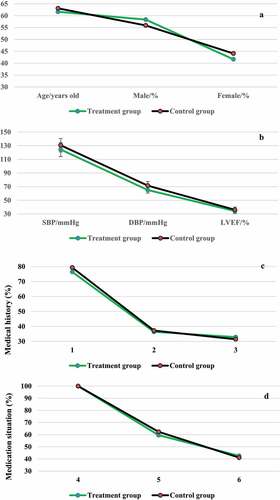
Figure 8. Partial echocardiographic analysis of patients. (A was a sample of a 25-year-old male patient; B was a sample of a 40-year-old female patient).
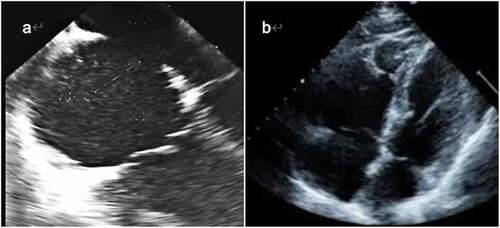
Figure 9. Comparison of cell proliferation activity between the two groups of EPCs.
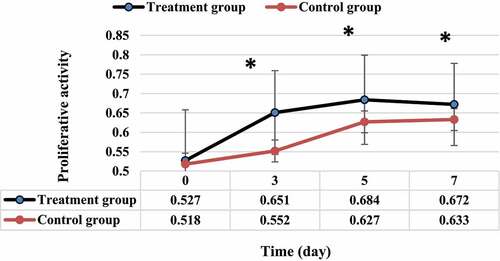
Figure 10. Comparison of cell adhesion ability between the two groups of EPCs.
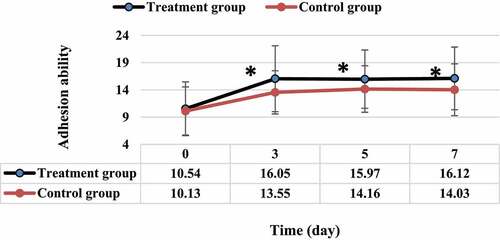
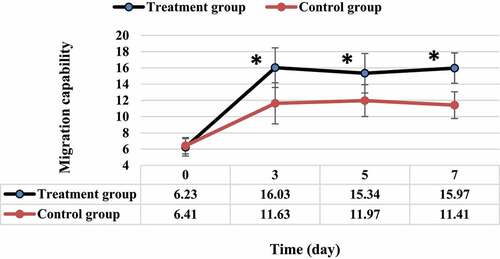
Figure 11. Comparison of cell migration ability between the two groups of EPCs.