Figures & data
Table 1. Primer sequences
Table 2. Depression of miR-889-3p is associated with LNM and clinicopathological stage
Figure 1. Knockdown of miR-889-3p is manifested in LC tissues and cell lines
A. MiR-889-3p in LC and adjacent normal tissues analyzed by RT-qPCR; B. Representative association of miR-889-3p with negative or positive LNM; C. Representative correlation of miR-889-3p with tumor stage I/II or III; D. RT-qPCR employed for detection of miR-889-3p in LC cell lines (A549, H1975, H1299, H460, SPC-A1) and BEAS-2B. The data in the figures were all measurement data in the form of mean ± SD. * vs the BEAS-2B, P < 0.05.
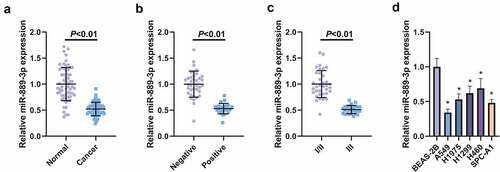
Figure 2. MiR-889-3p represses the proliferation and EMT of LC cells
A. After transfection of miR-889-3p or in-miR-889-3p, miR-889-3p in A549 cells detected by qPCR; B. The growth rate of cells after transfection of miR-889-3p or in-miR-889-3p detected by CCK-8 method; C. Cell proliferation after transfection with miR-889-3p or in-miR-889-3p examined by plate cloning; D. Migration and invasion of cells after transfection with miR-889-3p or in-miR-889-3p detected by Transwell; E. Flow cytometry employed to detect apoptosis after transfection with miR-889-3p or in-miR-889-3p; F. Detection via qPCR for EMT-related molecules E-cadherin and N-cadherin. G. Western Blot analysis of pAkt, Perk, N-cadherin and Vimentin protein levels. The data in the figures were all measurement data in the form of mean ± SD. * vs the miR-NC, P < 0.05; + vs the in-miR-NC, P < 0.05.
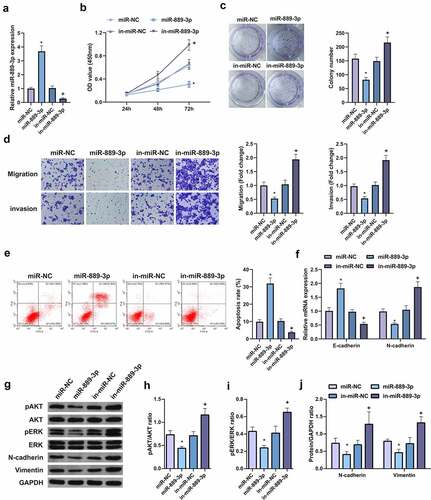
Figure 3. HIPK1 is sponged via miR-889-3p
A. The binding sites of HIPK1 with miR-889-3p manifested in StarBase software; B. MiR-889-3p enrichment in A549 cells by Ago2 antibody or IgG; C. HIPK1 enrichment in A549 cells by Ago2 antibody or IgG, and the targeting of miR-889-3p with HIPK1 verified via dual luciferase reporting experiment; D. Detection via qPCR for HIPK1 in clinical samples; E. Detection via qPCR for HIPK1 in cell lines; F. HIPK1 in clinical samples detected by Western Blot; G. HIPK1 in cell lines detected by Western Blot. The data in the figures were all measurement data in the form of mean ± SD. * vs the BEAS-2B, P < 0.05.
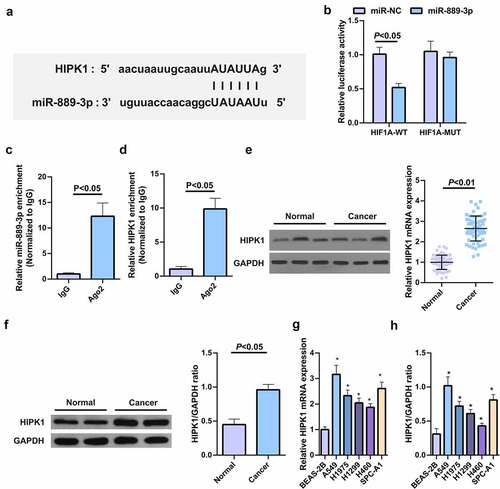
Figure 4. HIPK1 depletion inhibits the proliferation and EMT of LC cells
A/B. After HIPK1 silencing, HIPK1 in A549 cells detected by qPCR and Western Blot; C. Cell growth rate after HIPK1 silencing examined by CCK8 method; D. The proliferation of HIPK1 silenced cells detected by plate cloning; E. Cell migration and invasion after HIPK1 silencing detected via Transwell; F. Apoptosis after HIPK1 silencing detected by flow cytometry; G. EMT-related molecules E-cadherin and N-cadherin detected by PCR. H. Western Blot analysis of pAkt, Perk, N-cadherin, and Vimentin protein levels. The data in the figures were all measurement data in the form of mean ± SD. # vs the si-NC, P < 0.05.
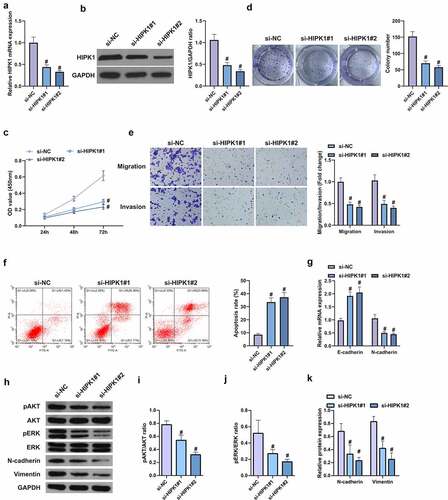
Figure 5. HIPK1 overexpression motivates the growth and metastasis of LC cells
A. qPCR to detect the expression of HIPK1 after elevation of HIPK1; B/C. CCK-8 and plate cloning to detect the proliferation of cells after elevated HIPK1; D. Transwell to detect the invasion and migration abilities of cells after elevated HIPK1; E. Cell apoptosis after elevated HIPK1 detected by flow cytometry; F. EMT-related molecules E-cadherin and N-cadherin detected by PCR; G. Western Blot analysis of pAkt, Perk, N-cadherin and Vimentin protein levels. The data in the figures were all measurement data in the form of mean ± SD. & vs the oe-NC, P < 0.05.
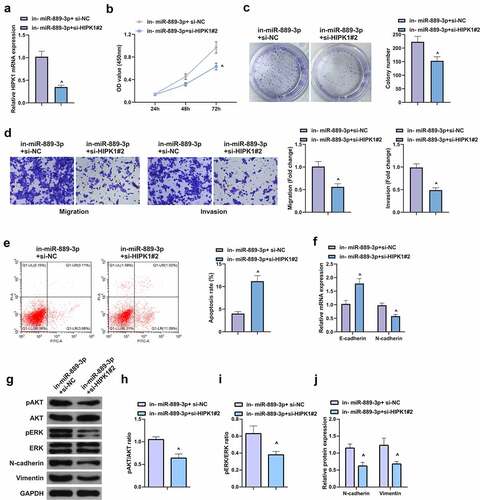
Figure 6. HIPK1-mediating miR-889-3p takes part in LC cell proliferation and EMT
A. Detection via qPCR for HIPK1 in A549 cells; B. The cell growth rate in each group detected by CCK-8 method; C. Cell proliferation in each group detected by plate cloning; D. Cell migration and invasion in each group detected by Transwell; E. Apoptosis in each group examined via Flow cytometry; F. EMT-related molecules E-cadherin and N-cadherin detected via PCR. The data in the figures were all measurement data in the form of mean ± SD. ^ vs the si-NC, P < 0.05.
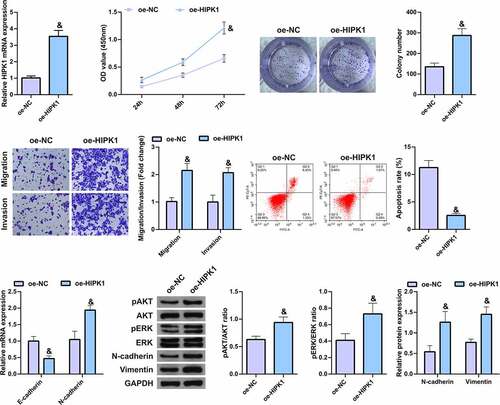
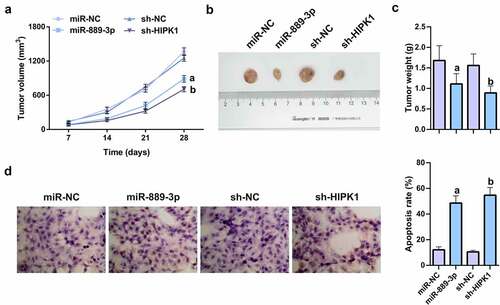
Figure 7. MiR-889-3p upregulation or HIPK1 knockdown represses tumor growth in vivo.
A. Growth curve images of nude mice after subcutaneous injection of each group of cells; B. Tumor images after 28 days; C. Tumor weight in nude mice 28 days after subcutaneous injection of cells in each group; D. TUNEL staining to detect apoptosis in the tumor tissue of each group. The data in the figures were all measurement data in the form of mean ± SD; a vs the miR-NC, P < 0.05; b vs the sh-NC, P < 0.05.