
Figures & data
Table 1. Comparisons of baseline characteristic of subjects among the DR, NDR and control groups
Table 2. Sequence of the primers used in this study
Figure 1. CYB5R2 and miR-6720-5p are associated with DR. (a) The DEGs in GSE53257 with adj.P < 0.05. GSE63257, mRNA expression profile including 6 DR samples and 5 non-DR samples. (b-g) The expression levels of ACSM3, DSCC1, SARDH, VISA, CYB5R2 and EHHADH in blood samples from DR, D and HC patients. DR, diabetic retinopathy. D, diabetes. HC, healthy control. (h) miR-494-3p, miR-6720-5p and miR-6512-3p were the common miRNAs binding to MEG3 and CYB5R2. starBase, an online tool for the prediction of miRNAs binding to MEG3. TargetScan, an online tool for the prediction of miRNAs binding to CYB5R2. (i-k) The expression levels of miR-494-3p, miR-6720-5p and miR-6512-3p in blood samples from DR, D and HC patients. DR, diabetic retinopathy. D, diabetes. HC, healthy control. *P < 0.05; **P < 0.001
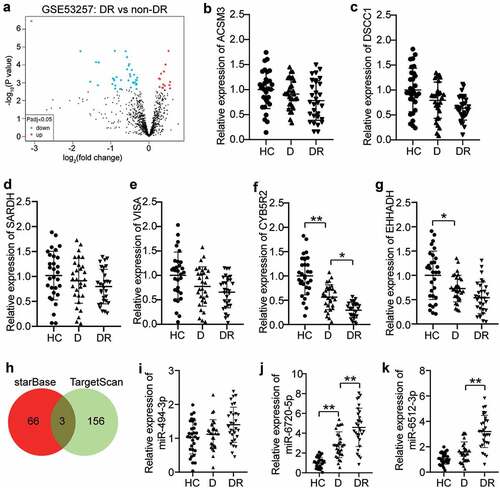
Table 3. The downregulated DEGs in GSE53257
Figure 2. Silencing MEG3 promotes neovascularization. (a) Serum levels of MEG3 in DR, D, HC groups. (b) The expression level of MEG3 in the retinal tissue microenvironment of DR and normal rat. (c)The expression level of MEG3 in the acute fluctuation of blood glucose level. (d) The expression level of MEG3 was measured by qRT-PCR in hRMECs treated with HG, NG or OS. (e) The expression level of MEG3 was detected by qRT-PCR in hRMECs transfected with si-MEG3. (f) Cell viability was detected by using MTT assay in hRMECs transfected with si-MEG3. (g) Cell apoptosis rate was detected by using flow cytometry assay in hRMECs transfected with si-MEG3. (h) Cell migration was assessed using transwell assay after treatment with si-MEG3. Representative images were shown. (i) Tube formation assay was used to detect tubulogenesis of hRMECs transfected with si-MEG3. Representative images were shown. DR, diabetic retinopathy. D, diabetes. HC, healthy control. HG, high glucose. OS, osmotic control. NG, normal glucose. *P < 0.05; **P < 0.001
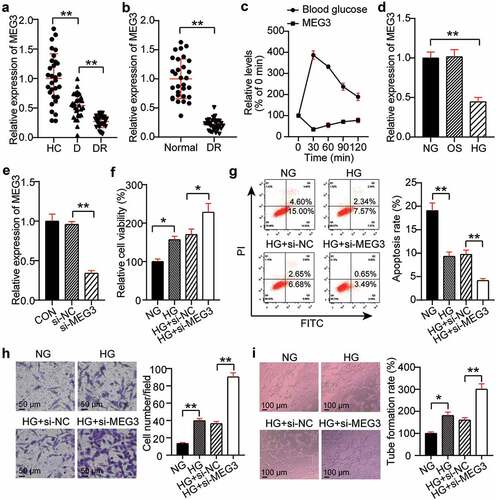
Table 4. Pearson correlation analysis between plasma MEG3 and various indexes in the DR group
Figure 3. MEG3 acts on neovascularization by regulating miR-6720-5p. (a) Alignment of potential miR-6720-5p binding sites in MEG3. (b) Luciferase activity was detected in hRMECs transfected with constructs containing wild-type of MEG3 or mutated MEG3 plasmid in response to the transfection of miR-6720-5p mimic. (c) The expression level of miR-6720-5p in the retinal tissue microenvironment of DR and normal rat. (d) The expression level of miR-6720-5p was measured by qRT-PCR in hRMECs treated with HG, NG or OS. (e) The expression level of miR-6720-5p was detected by qRT-PCR in hRMECs transfected with si-MEG3 or miR-6720-5p inhibitor. (f) Cell viability was detected by using MTT assay in hRMECs transfected with si-MEG3 or miR-6720-5p inhibitor. (g) Cell apoptosis rate was detected by using flow cytometry assay in hRMECs transfected with si-MEG3 or miR-6720-5p inhibitor. (h) Cell migration was assessed using transwell assay after treatment with si-MEG3 or miR-6720-5p inhibitor. Representative images were shown. (i) Tube formation assay was used to detect tubulogenesis of hRMECs transfected with si-MEG3 or miR-6720-5p inhibitor. Representative images were shown. HG, high glucose. OS, osmotic control. NG, normal glucose. *P < 0.05; **P < 0.001
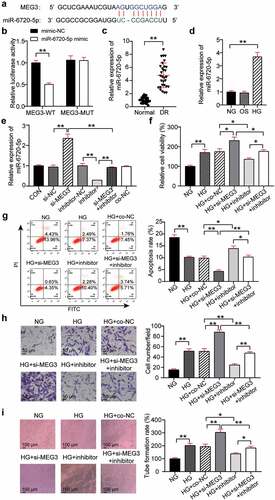
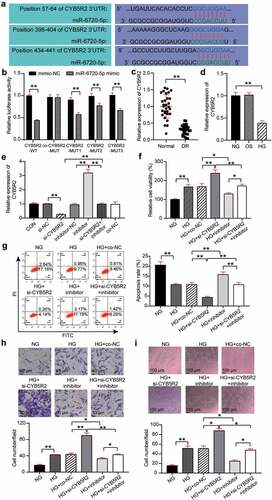
Figure 4. CYB5R2 is the target gene of miR-6720-5p, and knockdown of CYB5R2 reversed the inhibitory effect of miR-6720-5p inhibitor on neovascularization. (a) Alignment of potential CYB5R2 binding sites in miR-6720-5p. (b) Luciferase activity was detected in hRMECs transfected with constructs containing wild-type of CYB5R2 or mutated CYB5R2 plasmid in response to the transfection of miR-6720-5p mimic. (c) The expression level of CYB5R2 in the retinal tissue microenvironment of DR and normal rat. (d) The expression level of CYB5R2 was measured by qRT-PCR in hRMECs treated with HG, NG or OS. (e) The expression level of CYB5R2 was detected by qRT-PCR in hRMECs transfected with si-CYB5R2 or miR-6720-5p inhibitor. (f) Cell viability was detected by using MTT assay in hRMECs transfected with si-CYB5R2 or miR-6720-5p inhibitor. (g) Cell apoptosis rate was detected by using flow cytometry assay in hRMECs transfected with si-CYB5R2 or miR-6720-5p inhibitor. (h) Cell migration was assessed using transwell assay after treatment with si-CYB5R2 or miR-6720-5p inhibitor. Representative images were shown. (i) Tube formation assay was used to detect tubulogenesis of hRMECs transfected with si-CYB5R2 or miR-6720-5p inhibitor. Representative images were shown. HG, high glucose. OS, osmotic control. NG, normal glucose. *P < 0.05; **P < 0.001
Data availability statement
The datasets used and/or analyzed during the current study are available from the corresponding author on reasonable request.