
Figures & data
Table 1. The primer sequences in RT-PCR assay
Figure 1. DEX protected against lung injury in CLP-induced mice model. (a) Pathological changes of the lung samples in CLP-induced mice. Representative HE staining of lung tissue slices from sham, CLP, and different DEX doses groups. DEX-L low dose of DEX (2.5 μg/kg), DEX-M medium dose of DEX (5 μg/kg), and DEX-H high dose of DEX (10 μg/kg). Scale bars 50 µm. (b) Pathological score of the lung sample in each group. (c) The W/D weight ratio of the lung in each group. (d) MPO activity of the lung samples in mice. (e) Inflammatory cytokines level of TNF-α, IL-1β, and NLRP3 in BALF sample. The mice were i.p. injected with 2.5, 5, and 10 μg/kg of DEX 30 min after CLP procedure. Three animals in each group were sacrificed to collect lung and BALF after 24 h. N = 6. Data were expressed as mean ± SD. *P < 0.05, vs. sham; #P < 0.05, vs. CLP mice
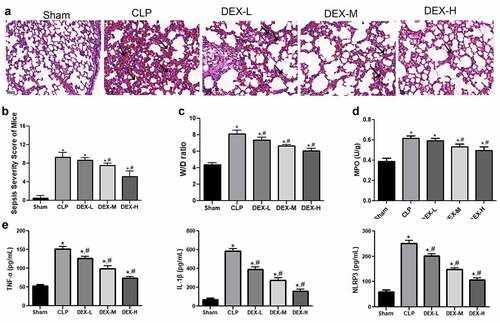
Figure 2. The viral infection efficiency after RAGE overexpression mice construction. (a) The relative mRNA expression of RAGE after infection using RT-qPCR. (b) The relative protein RAGE expression after infection by Western blot. (c) The eGFP-oeRAGE expression in the lung tissues of the RAGE overexpression mice. N = 6. Data were expressed as mean ± SD. *P < 0.05 vs. sham + vector; #P < 0.05 vs. CLP + vector
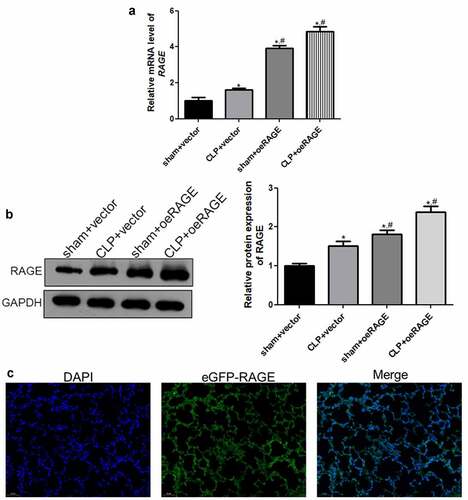
Figure 3. Protective effect of DEX on the pathological manifestation of lung tissue could be impaired by injection of RAGE lentiviral. (a) Representative HE staining of lung tissue slices from sham, CLP, CLP + DEX (10 μg/kg), and CLP +DEX + RAGE overexpression (oeRAGE) group. Scale bars = 50 µm. RAGE-overexpressed mice model was constructed by i.v injection of RAGE-overexpressed lentivirus supernatants. (b) Pathological score of lung samples in each group. (c) The W/D weight ratio of the lung in each group. (d) MPO activity of the lung sample in mice. (e) Inflammatory cytokine release of TNF-α, IL-1β, and NLRP3 in BALF sample of mice. RAGE-overexpressed mice model was constructed by i.v injection of RAGE-overexpressed lentivirus supernatants. The mice were treated with DEX (10 μg/kg) 30 min after the CLP procedure. Three animals in each group were sacrificed to collect BALF samples after 24 h. = 6. Data were expressed as mean ± SD. *P < 0.05 vs. sham; #P < 0.05 vs. CLP mice; $P < 0.05, vs. CLP + DEX
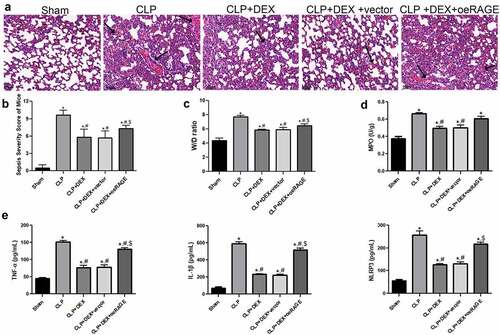
Figure 4. RT-qPCR (a) and Western blot (b) analyses of HMGB1/RAGE pathway and pyroptosis-related proteins in mice. The expression of mRNAs and proteins was normalized with a housekeeping gene GAPDH. ˆ = 6. Data were expressed as mean ± SD. *P < 0.05, vs. sham; # P < 0.05, vs. CLP mice; $P < 0.05, vs. CLP + DEX
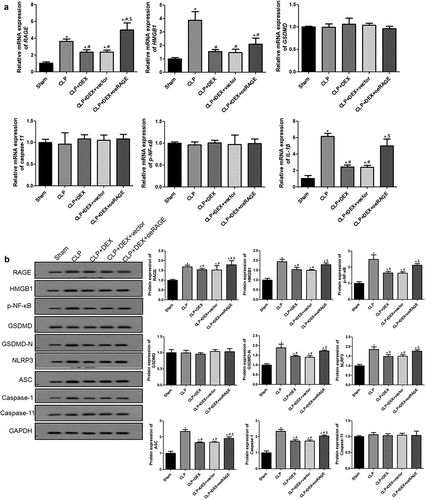
Figure 5. Inflammatory cytokine release in LPS-exposed MLE-12 cell (a) and immunofluorescence analysis of HMGB1 location in LPS-stimulated MLE-12 cells (b). After 24 h of LPS (1 μg/mL) exposure, the MLE-12 cells were treated with DEX (10 μM) or RAGE-overexpressed lentivirus for 18 h. Subsequently, cell supernatant was collected, and inflammatory cytokines were determined by ELISA. N = 6. Data were expressed as mean ± SD. *P < 0.05, vs. LPS; #P < 0.05, vs. LPS + DEX
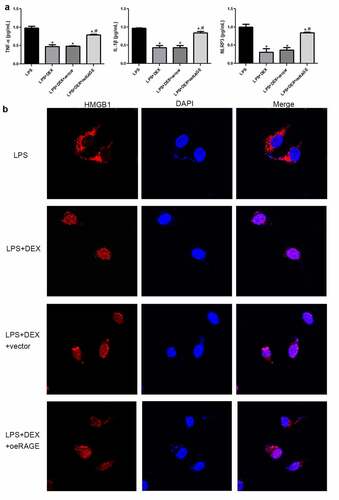
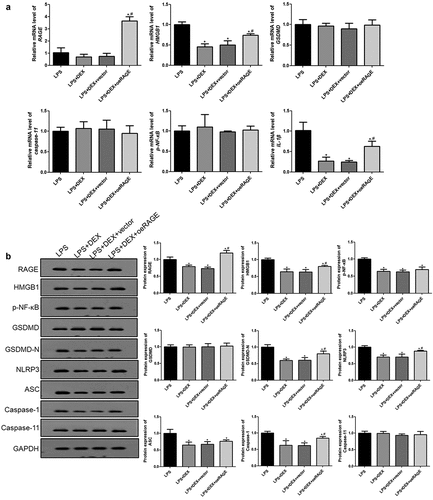
Figure 6. RT-qPCR (a) and Western blot (b) analyses of HMGB1/RAGE pathway and pyroptosis-related proteins in LPS-treated MLE-12 cell. N = 6. Data were expressed as mean ± SD. #P < 0.05, vs. LPS; $P < 0.05, vs. LPS + DEX
Data availability
All data generated or analyzed during this study are available from the corresponding author upon reasonable request.