
Figures & data
Figure 1. The effects of Maprotiline on cell viability in BV2 microglial cells. (a). Molecular structure of Maprotiline; (b). Cells were stimulated with Maprotiline at the concentrations of 0, 0.1, 0.2, 1, 2, 5, 10, 20 μM for 24 hours. Cell viability was measured using WST-1 assay (#, ##, ###, P < 0.05, 0.01, 0.005 vs. vehicle group)
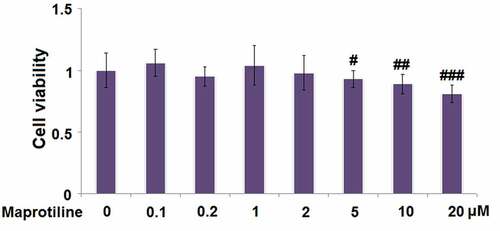
Figure 2. Maprotiline ameliorated Isoflurane-induced reduction of cell viability and release of LDH in BV2 microglial cells. Cells were stimulated with 2% Isoflurane with or without Maprotiline (1, 2 μM) for 24 hours. (a). Cell viability; (b). Release of LDH; (c). Cell morphology of BV2 microglial cells (###, P < 0.005 vs. vehicle group; *, **, P < 0.05, 0.01 vs. Isoflurane group)
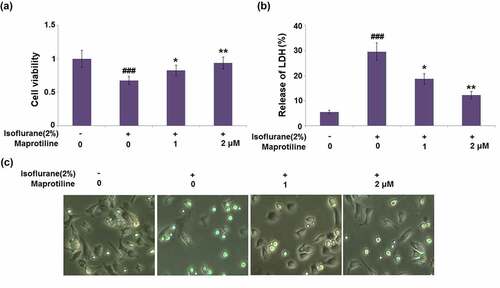
Figure 3. Maprotiline ameliorated Isoflurane-induced oxidative stress in BV2 microglial cells. (a). Mitochondrial ROS; (b). The levels of SOD activity (###, P < 0.005 vs. vehicle group; *, **, P < 0.05, 0.01 vs. Isoflurane group)
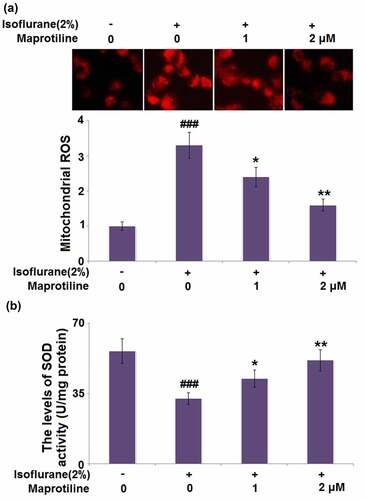
Figure 4. Maprotiline suppressed Isoflurane-induced expression of pro-inflammatory cytokines. (a). mRNA levels of TNF-α and IL-1β; (b). Secretions of TNF-α and IL-1β (###, P < 0.005 vs. vehicle group; *, **, P < 0.05, 0.01 vs. Isoflurane group)
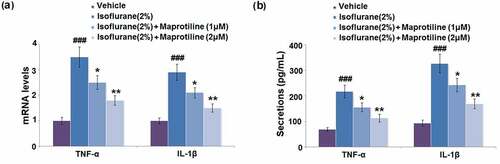
Figure 5. Maprotiline inhibited the expression of COX-2 and the production of PGE2. Cells were stimulated with 2% Isoflurane with or without Maprotiline (1, 2 μM) for 24 hours. (a). mRNA levels of COX-2; (b). Protein levels of COX-2; (c). The production of PGE2 (###, P < 0.005 vs. vehicle group; *, **, P < 0.05, 0.01 vs. Isoflurane group)
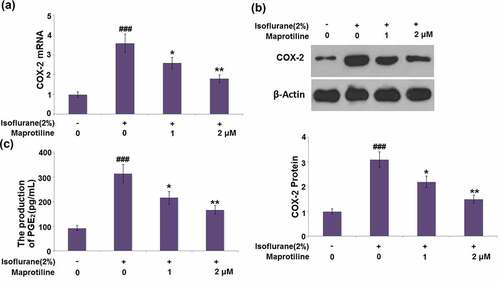
Figure 6. Maprotiline inhibited the expression of Iba1 in BV2 microglial cells. (a). mRNA of Iba1; (b). Protein levels of Iba1 (###, P < 0.005 vs. vehicle group; *, **, P < 0.05, 0.01 vs. Isoflurane group)
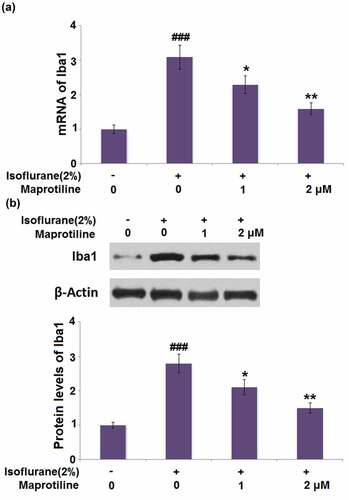
Figure 7. Isoflurane reduced the expression of TREM2 in BV2 microglia cells. Cells were stimulated with 1% and 2% Isoflurane for 24 hours. (a). mRNA of TREM2; (b). Protein of TREM2 (#, ##, P < 0.05, 0.01 vs. vehicle group)
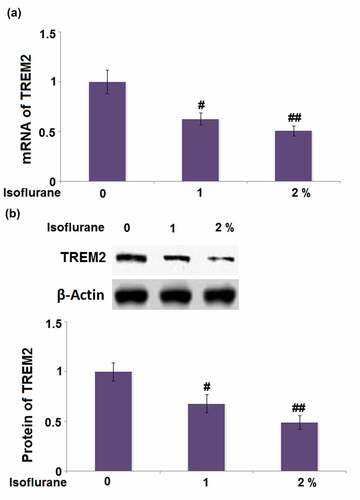
Figure 8. Maprotiline restored Isoflurane-induced reduction of TREM2 in BV2 microglia cells. Cells were stimulated with 2% Isoflurane with or without Maprotiline (1, 2 μM) for 24 hours. (a). mRNA of TREM2; (b). Protein of TREM2 (###, P < 0.005 vs. vehicle group; *, **, P < 0.05, 0.01 vs. Isoflurane group)
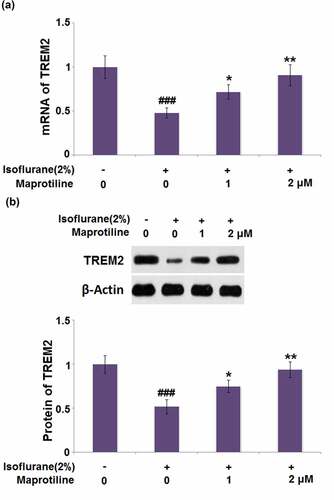
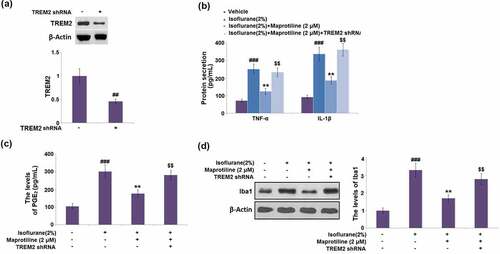
Figure 9. The beneficial effects of Maprotiline against Isoflurane are mediated by TREM2. Cells were transduced with lentiviral TREM2 shRNA, followed by stimulation with 2% Isoflurane with or without Maprotiline (2 μM) for 24 hours. (a). Western blot results revealed successful knockdown of TREM2; (b). The levels of TNF-α, IL-1β; (c). The levels of PGE2; (d). The levels of Iba1 (###, P < 0.005 vs. vehicle group; **, P < 0.01 vs. Isoflurane group; $$, Isoflurane+ Maprotiline group)
Data Availability Statement
Data of this study is/are available upon reasonable request to the corresponding authors.