
Figures & data
Figure 1. Circ_0061140 is upregulated in LAUD under hypoxia. (a) RT-qPCR was used to detect the expression of circ_0061140 in LAUD tissues. (b) Kaplan-Meier method performed the survival curves of circ_0061140 in LAUD patients. (c) RT-qPCR showed the expression of circ_0061140 in OC cell lines (A549, NCI-H23, H1975 and H1299) and human bronchial epithelial cell line (HBE). (d and e) RT-qPCR showed circ_0061140 expression in A549 and NCI-H23 cells after 1% hypoxia exposure for 0, 6, 12, 24, and 48 h. *P < 0.05, **P < 0.01.
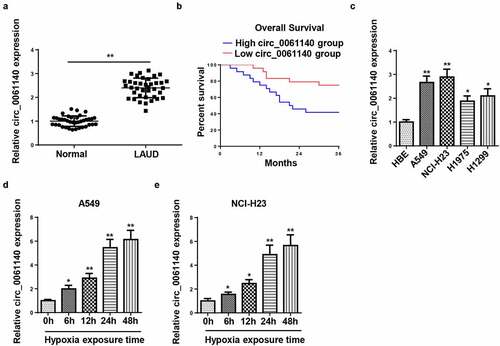
Figure 2. Circ_0061140 deletion hampers hypoxia-stimulated glycolysis and metastasis of LAUD cells. (a) RT-qPCR showed the expression of circ_0061140 in A549 and NCI-H23 cells transfected with si_circ_0061140 or si-NC in LAUD under hypoxic condition. (b-d) Glycolysis was evaluated by the glucose consumption, lactate production, and Western blotting showed glycolysis-associated enzyme HK2 protein level. (e and f) Wound healing and transwell assays showed the migration and invasion of A549 and NCI-H23 cells transfected with si_circ_0061140 or si-NC in LAUD under hypoxic condition. *P < 0.05, **P < 0.01, ***P < 0.001.
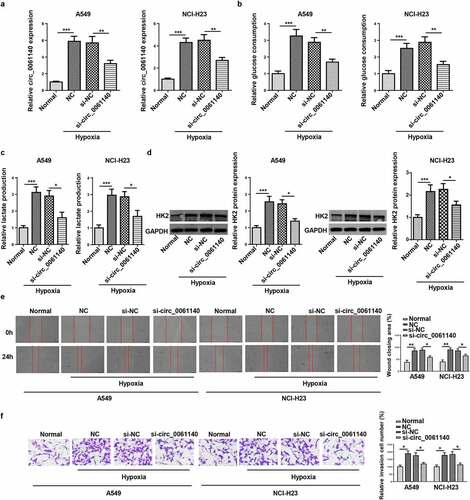
Figure 3. miR-653 is sponged by circ_0061140. (a) Putative binding regions of circ_0061140 in miR-653 predicted with Circular RNA Interactome. (b) Luciferase reporter assay showed the luciferase activity of wild-type or mutant circ_0061140 in A549 and NCI-H23 cells transfected with NC mimics or miR-653 mimics. (c) RIP assay showed the levels of circ_0061140 and miR-653 of A549 and NCI-H23 cells in Ago2 group. (d and e) RT-qPCR analysis was used to detect the expression of miR-653 in LAUD tissues and cells. (f and g) The abundances of miR-653 was detected in A549 and NCI-H23 cells after exposure of hypoxia. The data were presented as mean ± SD *P < 0.05, **P < 0.01.
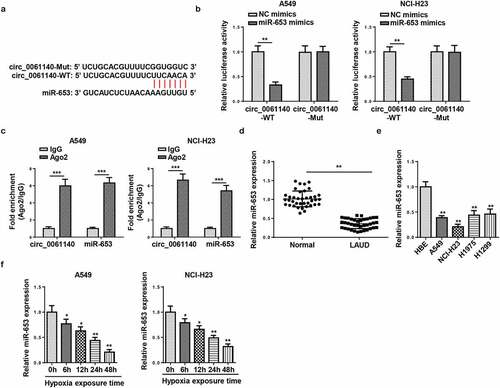
Figure 4. HK2 is targeted by miR-653. (a) Venn diagram analysis showed the potential target of miR-653. (b) Luciferase reporter gene assay showed the luciferase activity of wild-type or mutant HK2 in A549 and NCI-H23 cells transfected with NC mimics or miR-653 mimics. (c and d) RT-qPCR analysis showed the expression of HK2 in LAUD tissues and cell lines. (e) RT-qPCR determined HK2 expression in A549 and NCI-H23 cells after hypoxia exposure for 0, 6, 12, 24, and 48 h. *P < 0.05, **P < 0.01.
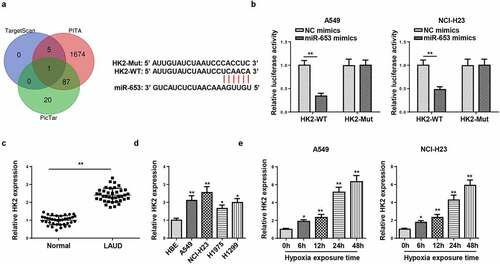
Figure 5. Circ_0061140 modulates HK2 expression through absorbing miR-653. (a and b) Pearson correlation analysis showed the correlation between miR-653 and circ_0061140 or HK2 expression in LAUD tissues. (c) Pearson correlation analysis showed the correlation between circ_0061140 and HK2 expression in LAUD tissues. (d and e) RT-qPCR analysis showed the expression of miR-653 in A549 and NCI-H23 cells transfected with si-NC, si_circ_0061140 and si_circ_0061140+ miR-653 inhibitor. (f and g) Western blotting analysis showed the expression of HK2 in A549 and NCI-H23 cells transfected with si-NC, si-circ_0061140 and si-circ_0061140+ miR-653 inhibitor. *P < 0.05, **P < 0.01.
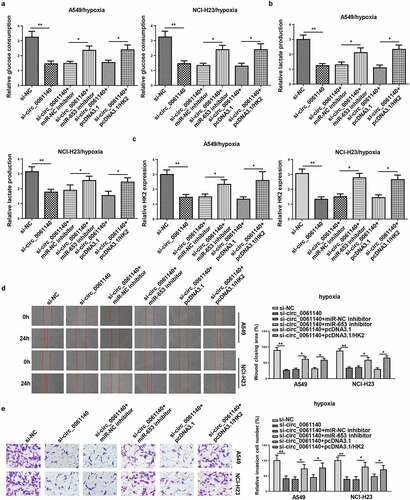
Figure 6. Circ_0061140 deficiency represses LAUD progression by regulating miR-653 and HK2 under hypoxia. (a–c) Glycolysis was evaluated by the glucose consumption, lactate production, and RT-qPCR showed HK2 expression in A549 and NCI-H23 cells transfected with si-NC, si-circ_0061140, si-circ_0061140+ miR-NC inhibitor, si_circ_0061140+ miR-653 inhibitor, si-circ_0061140+ pcDNA3.1, and si-circ_0061140 + pcDNA3.1/HK2. (d and e) Wound healing and transwell assays showed the migration and invasion of A549 and NCI-H23 cells transfected with si-NC, si-circ_0061140, si-circ_0061140+ miR-NC inhibitor, si-circ_0061140+ miR-653 inhibitor, si-circ_0061140+ pcDNA3.1 and si-circ_0061140 + pcDNA3.1/HK2. The data were presented as mean ± SD *P < 0.05, **P < 0.01.
Data availability
The datasets generated during and/or analyzed during the current study are available from the corresponding author on reasonable request.