
Figures & data
Figure 1. Circ007293 was enriched in the exosomes from PTC patient serum and PTC cell lines. (a) Western blotting results of CD63 and CD81 expression in serum of PTC patients (T-serun; n = 40), serum of healthy controls (N-serum; n = 40), exosomes derived from the serum of PTC patients (T-exo; n = 40) or healthy controls (N-exo; n = 40). (b) The expression of circ007293 in T-exo or N-exo was analyzed using qRT-PCR. (c-e) TEM, NTA, and Western blotting were performed to confirm exosomes derived from Nthy-ori3-1 (Nthy-ori3-1-exo), TPC-1 (TPC-1-exo), or KTC-1 (KTC-1-exo) cells. (f) The expression of circ007293 in different PTC cell lines and exosomes derived from different cells was analyzed using qRT-PCR. (g) The expression of circ007293 in TPC-1 and KTC-1 cells transfected with oe-circ007293 or oe-NC was determined by qRT-PCR. (h) The expression of circ007293 in exosomes derived from TPC-1 and KTC-1 cells transfected with oe-circ007293 or oe-NC was analyzed using qRT-PCR. (i) The expression of circ007293 in TPC-1 and KTC-1 cells transfected with si-circ007293 or si-NC was analyzed using qRT-PCR. (j) The expression of circ007293 in exosomes derived from TPC-1 and KTC-1 cells transfected with si-circ007293 or si-NC was determined using qRT-PCR. **p < 0.01, and ***p < 0.001 compared to the control group
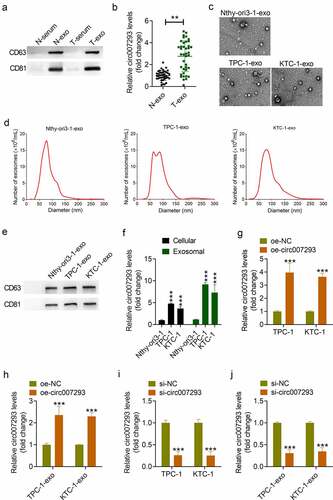
Table 1. The correlation between serum exosomal circ-007293 and clinicopathological features in PTC patients
Figure 2. PTC cell-derived exosomal circ007293 promoted PTC cell proliferation, migration, invasion, and EMT. (a) Exosome uptake was assessed to confirm the uptake of PKH26-labeled oe-circ007293-exo (red) into recipient TPC-1 and KTC-1 cells. Magnification: ×200; scale bar: 50 μM. (b) Both oe-NC-exo and oe-circ007293-exo treatment increased the expression of circ007293 in TPC-1 and KTC-1 cells. (c) The viability of TPC-1 and KTC-1 cells co-cultured with oe-NC-exo or oe-circ007293-exo was evaluated using CCK-8 assay. (d) The migration of TPC-1 and KTC-1 cells co-cultured with oe-NC-exo or oe-circ007293-exo was analyzed using wound healing assay. Magnification: ×100; scale bar: 100 μM. (e) The invasion of TPC-1 and KTC-1 cells co-cultured with oe-NC-exo or oe-circ007293-exo was analyzed using transwell assay. Magnification: ×200; scale bar: 50 μM. (f) The levels of EMT protein markers (E-cadherin, N-cadherin, and vimentin) in TPC-1 and KTC-1 cells co-cultured with oe-NC-exo or oe-circ007293-exo were analyzed using Western blotting. *p < 0.05 and **p < 0.01 compared to the PBS group; ##p < 0.01 and ###p < 0.001 compared to the oe-NC-exo group
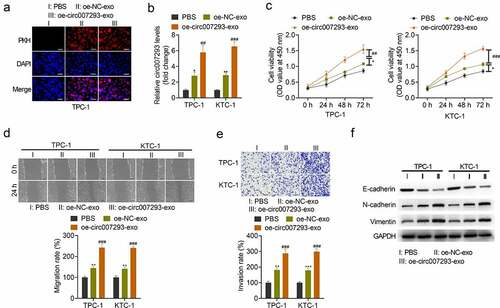
Figure 3. Knockdown of circ007293 suppressed the malignant phenotype of PTC cells. (a) circ007293 expression in TCP-1 and KTC-1 cells transfected with si-circ007293 or si-NC was determined using qRT-PCR. (b) The viability of TPC-1 and KTC-1 cells transfected with si-circ007293 or si-NC was evaluated using CCK-8 assay. (c) The migration of TPC-1 and KTC-1 cells transfected with si-circ007293 or si-NC was analyzed using wound healing assay. (d) The invasion of TPC-1 and KTC-1 cells transfected with si-circ007293 or si-NC was analyzed using transwell assay. (e) The expression levels of EMT protein markers (E-cadherin, N-cadherin, and vimentin) in TPC-1 and KTC-1 cells transfected with si-circ007293 or si-NC were determined using Western blotting. *p < 0.05, **p < 0.01, and ***p < 0.001 compared to the si-NC group
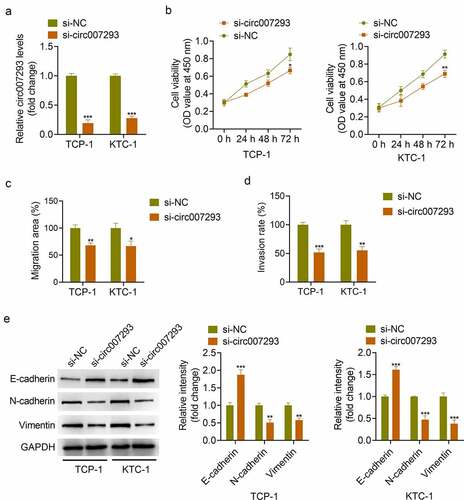
Figure 4. Circ007293 promoted PAX6 expression through acting as a ceRNA for miR-653-5p. (a) Subcellular fractionation for circ007293 in the nucleus and cytoplasm of TPC-1 and KTC-1 cells. (b) Left: Venn diagram showing miR-653-5p as the potential circ007293-targeting miRNA in the prediction results from Circinteractome and starBase. Right: Predicted binding sites of circ007293 and miR-653-5p, and miR-653-5p and PAX6 mRNA 3ʹUTR. (c) Evaluation of luciferase activity in TPC-1 and KTC-1 cells co-transfected with circ007293-WT or MUT reporter vectors and miR-653-5p or miR-NC. (d) Evaluation of luciferase activity in TPC-1 and KTC-1 cells co-transfected with PAX6-WT or MUT reporter vectors and miR-653-5p or miR-NC. (e) The expression of miR-653-5p in TPC-1 and KTC-1 cells transfected with oe-circ007293 or oe-NC was analyzed using qRT-PCR. (f) The mRNA and protein expression levels of PAX6 in TPC-1 and KTC-1 cells transfected with oe-circ007293 or oe-NC were determined by qRT-PCR and Western blotting, respectively. (g) The mRNA and protein expression levles of PAX6 in TPC-1 and KTC-1 cells co-transfected with miR-653-5p mimic and oe-circ007293 were analyzed using qRT-PCR and Western blotting, respectively. **p < 0.01 and ***p < 0.001
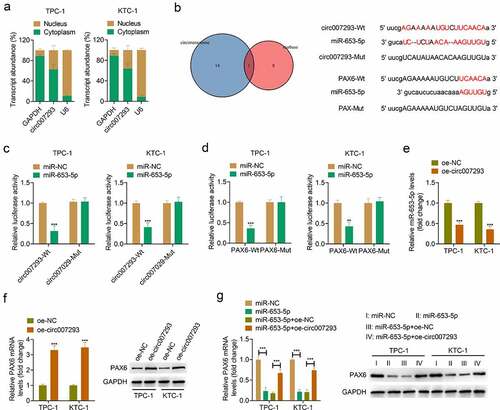
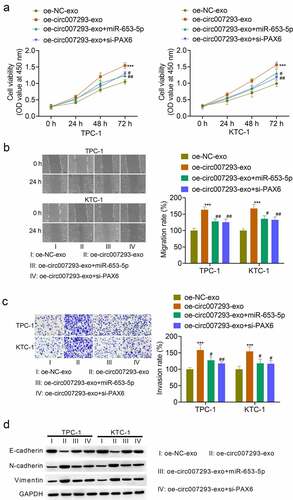
Figure 5. Exosomal circ007293 promoted the malignant phenotype of PCT cells via the miR-653-5p/PAX6 axis. TPC-1 and KTC-1 cells transfected with miR-653-5p mimic or si-PAX6 were treated with oe-circ007293-exo or oe-NC-exo. (a) The viability of TPC-1 and KTC-1 cells was evaluated using CCK-8 assay. (b) The migration of TPC-1 and KTC-1 cells was analyzed using wound healing assay. Magnification: ×100; scale bar: 100 μM. (c) The invasion of TPC-1 and KTC-1 cells was analyzed using transwell assay. Magnification: ×200; scale bar: 50 μM. (d) The expression of E-cadherin, N-cadherin, and vimentin in TPC-1 and KTC-1 cells was determined by Western blot. ***p < 0.001 compared to the oe-NC-exo group; #p < 0.05 and ##p < 0.01 compared to the oe-circ007293-exo group
Supplemental Material
Download TIFF Image (506.2 KB)Data availability statement
All data generated or analyzed during this study are included in this published article and its additional files.