
Figures & data
Figure 1. Data process and consensus modules detection. (a) the clustering trees of the samples of nonsmokers (upside) and smokers (downside) in GSE13850; (b) network topology analysis: network indices (y-axes) and their corresponding soft thresholding power (x-axes); (c) the Q-Q plot of TOM before (black) and after scaling (red); (d) the consensus modules before and after merging
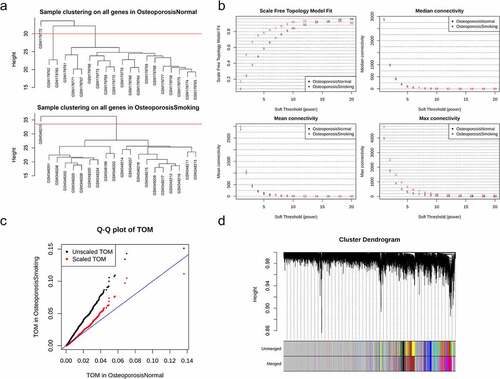
Figure 2. Smoking-related modules. (a) the correlation between modules detected in the samples of smokers in GSE13850 and consensus modules among the samples of both smokers and nonsmokers; (b) protein-protein interactions of the smoking-related specific genes in module ‘brown’; (c) the top 10 critical genes revealed by hub genes analysis; (d) relationships of modules detected in the smoking samples and the level of bone mineral density
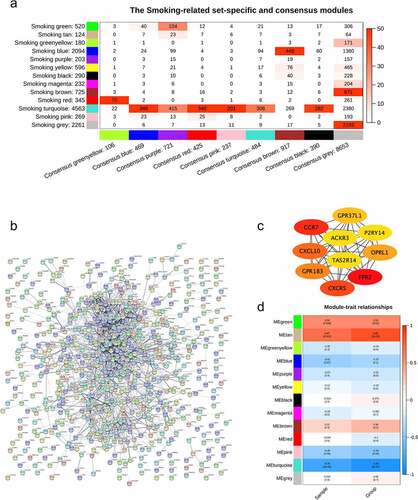
Figure 3. Correlations between consensus modules and the clinical traits. The relationship between consensus modules and BMD levels in the two groups were analyzed. The correlations between consensus modules and the BMD in smokers (a) and nonsmokers (b) and the consensus relationship between consensus modules and the clinical traits of smokers and nonsmokers (c) were depicted. The correlation scores were depicted with colors (blue for negative correlation, red for positive correlation); the lower absolute scores were used to denote the relationships with similar signs between the two groups, while ‘NA’ refers to those with opposite scores
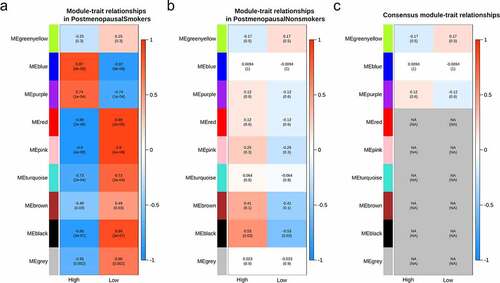
Figure 4. Function analysis and PPI analysis of the module ‘black’. The PPI and function analyses of consensus module ‘black’ were analyzed. (a) the predicted protein-protein interactions of genes in consensus module ‘black’ with STRING database; (b) critical genes revealed with the Cytoscape software; (c) KEGG pathways of genes in consensus module ‘black’
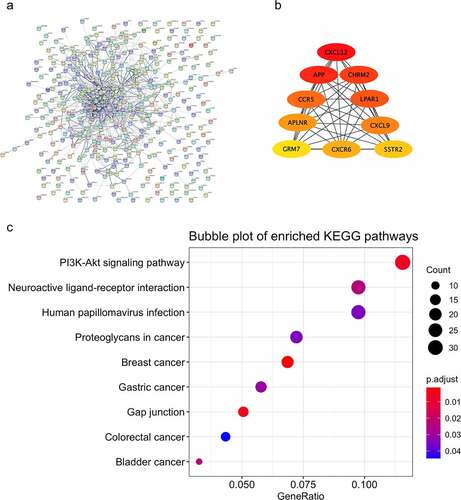
Figure 5. SVM-RFE analysis of genes in consensus module ‘black’. (a) the SVM-RFE model was constructed with smokers in GSE13850 and tested in the train set (blue) and the test set (red). (b) Testing analysis of the constructed SVM-RFE model with female nonsmokers in GSE13850 (blue), premenopausal female (yellow), and postmenopausal female (red) in GSE56815. The y-axis indicates the number of genes, while the x-axis shows the corresponding accuracy
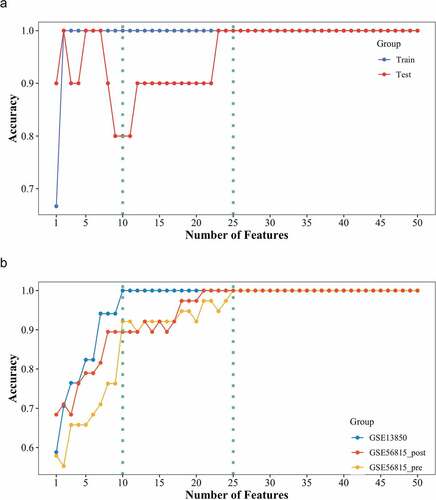
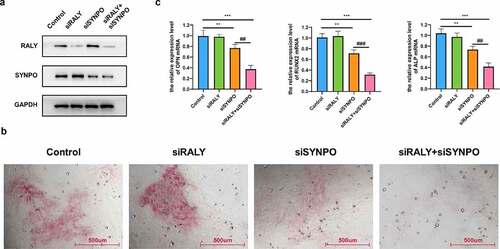
Figure 6. RALY and SYNPO regulate the osteogenic differentiation of hBMSCs. (a) The expression of RALY and SYNPO was detected by Western blot. (b) The osteogenic differentiation ability was detected by ARS staining assay. (c) The relative expression of osteogenic marker genes (OPN, RUNX2, and ALP) mRNA was detected by qRT-PCR. Compared with the control group, **P < 0.01, ***P < 0.001; Compared with the siSYNPO group, ##P < 0.01, ###P < 0.001
Availability of data and material
The datasets used and/or analyzed during the current study are available from the corresponding author on reasonable request.