
Figures & data
Table 1. Sources and characteristics of rapeseed (Brassica napus L.) germplasm accessions used in the present study
Figure 1. Microscopic color and morphology of testa from 35 rapeseed (Brassica napus L.) accessions from China
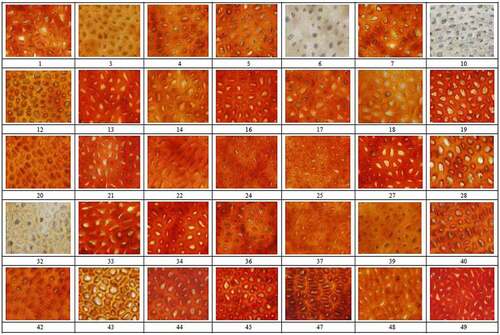
Table 2. Micromorphological testa traits of 35 rapeseed (Brassica napus L.) germplasm accessions from China
Table 3. Effect of imbibition duration on the water uptake and electrical conductivity of seed from rapeseed (Brassica napus L.) germplasm accessions from China
Figure 2. Effect of testa color and morphology on the water uptake rate of rapeseed accessions from China. (a) Effect of testa color. (b) Effect of testa morphology
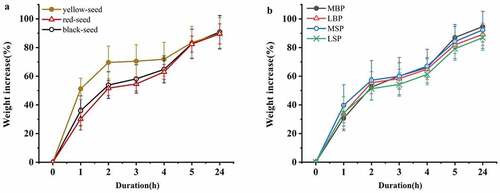
Figure 3. Effect of testa color and morphology on the rate of electric conductivity increase for rapeseed accessions from China. (a) Effect of testa color. (b) Effect of testa morphology
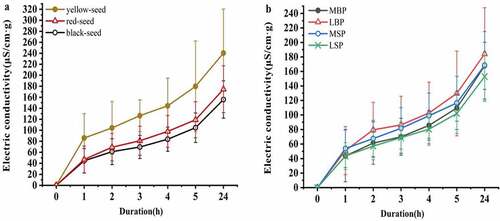
Figure 4. (a and d) Relative germination rate. (b and e) Relative seedling height. (c and f) DTI of seedling height
Figure 5. Principal component analysis of relationships among micromorphological testa characteristics. (a) Contribution of testa characteristics to two main principal components. (b) Grouping of accessions based on two main principal components
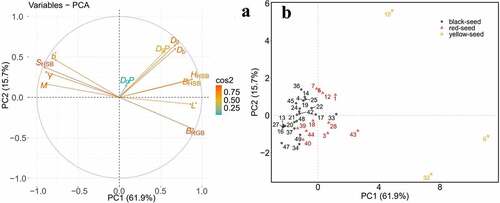
Table 4. Drought tolerance parameters of 35 rapeseed (Brassica napus L.) germplasm accessions from China
Table 5. Eigenvalues and contribution rate of principal components