Figures & data
Table 1. Primer sequences for B7-H3 isoforms
Figure 1. The mRNA expression of B7-H3 isoforms in 8 AML cell lines. (a-e) RT-PCR was used to analyze mRNA expression with various B7-H3-specific primers. The ordinate in B-E represents gray values of B7-H3, 4Ig B7-H3, B7-H3 isoforms (detected by B7-H3-specific primer 3), and B7-H3 isoforms (detected by B7-H3-specific primer 4)/gray value of β-actin, respectively. The data is gained from no less than 3 individual experiments
Figure 2. RT-PCR analysis of THP-1 and SKM-1 with B7-H3-specific primers by changing PCR conditions. (a) RT-PCR using B7-H3-specific primers in THP-1 and SKM-1 by increasing annealing temperature. The annealing temperature of primer 3 (up) and primer 4 (down) was 58.1°C, 61.3°C, 63.1°C, 66.4°C, 69°C and 59.9°C, 61.4°C, 62.5°C, 64.8°C, 68.9°C from left to right lanes, respectively. (b) RT-PCR using B7-H3-specific primers in THP-1 and SKM-1 by reducing cycles. The cycles were 35, 33, and 30 cycles from left to right lanes. The data is gained from no less than 3 individual experiments
Figure 3. The mRNA expression of B7-H3 isoforms in de novo AML patients and controls. RT-PCR with B7-H3-specific primer3 was used to detect mRNA expression of B7-H3 isoforms in AML patients and controls followed by analysis by ROC curve. (a-b) The ordinate represents gray values of 4Ig B7-H3 and 2Ig B7-H3/gray value of β-actin, respectively. (c-d) The ROC curve analysis of 4Ig B7-H3 and 2Ig B7-H3 mRNA expression. AUC, area under the ROC curve
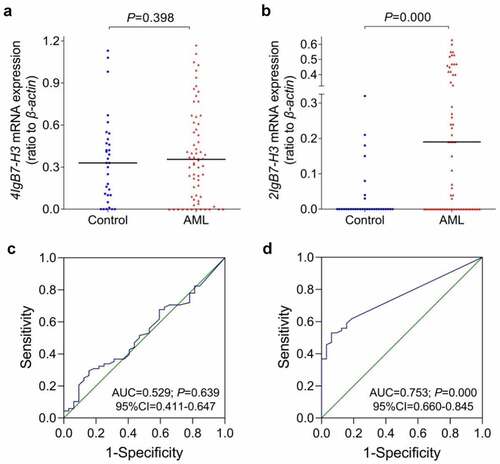
Table 2. Comparison of clinical manifestations and laboratory features between AML patients with low and high mRNA expression of 2Ig B7-H3 (2Ig)
Figure 4. B7-H3 isoforms in AML cell line membrane protein expression. (a) The histograms revealed the expression of B7-H3 isoforms, gating with isotype controls. The red and green lines in each histogram represent isotype control and B7-H3 isoforms, respectively. The antibody 2E6 bound both 4Ig B7-H3 and 2Ig B7-H3, while the antibody 3H4 specifically bound 4Ig B7-H3. (b-c) The mean fluorescence intensity (MFI) of total B7-H3 isoforms and 4Ig B7-H3 in AML cell lines. The data is gained from no less than 3 individual experiments
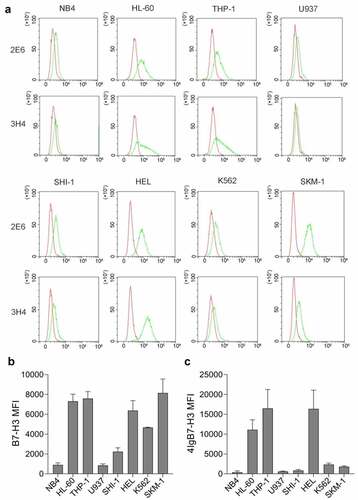
Figure 5. The membrane protein expression of B7-H3 isoforms in de novo AML patients and controls. (a-b) The expression rates of total B7-H3 isoforms and 4Ig on blast cells in AML patients and controls. (c-d) The mean fluorescence intensity ratio of blast cells and lymphocytes (MFI ratio) of total B7-H3 isoforms and 4Ig B7-H3 in AML patients and controls
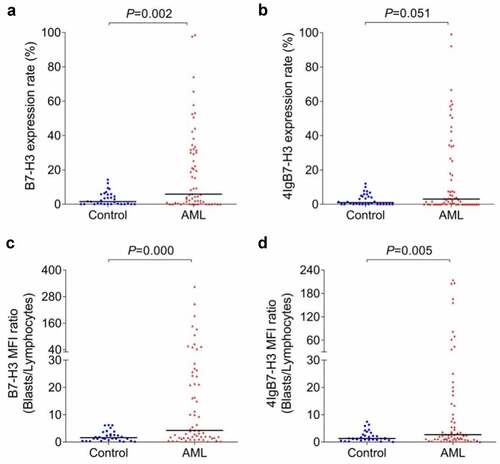
Figure 6. The ROC curve analysis of B7-H3 isoforms membrane protein expression in de novo AML patients and controls. (a-b) The expression rates of total B7-H3 isoforms and 4Ig on blast cells. (c-d) The mean fluorescence intensity ratio of blast cells and lymphocytes (MFI ratio) of total B7-H3 isoforms and 4Ig B7-H3. AUC, area under the ROC curve
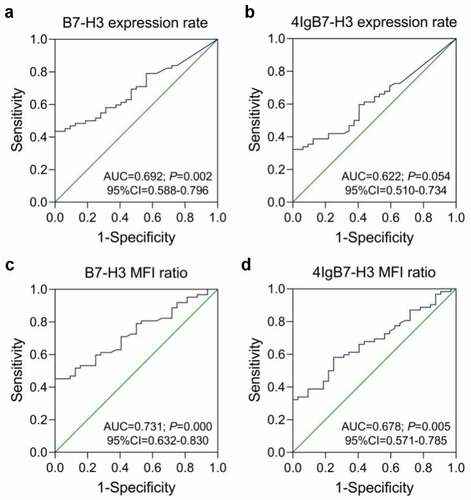
Table 3. Evaluation of clinical manifestations and laboratory features amongst AML patients with low and high membrane protein expression of total B7-H3 isoforms
Figure 7. The Kaplan–Meier analysis of B7-H3 isoforms expression in de novo AML patients. (a-b) The influence of 2Ig B7-H3 mRNA expression on OS in the whole AML and non-M3 AML patients, respectively. (c-d) The influence of total B7-H3 isoforms membrane protein expression on OS in the whole AML and non-M3 AML patients, respectively. Non-M3 AML, non-acute promyelocytic leukemia in AML; OS, overall survival
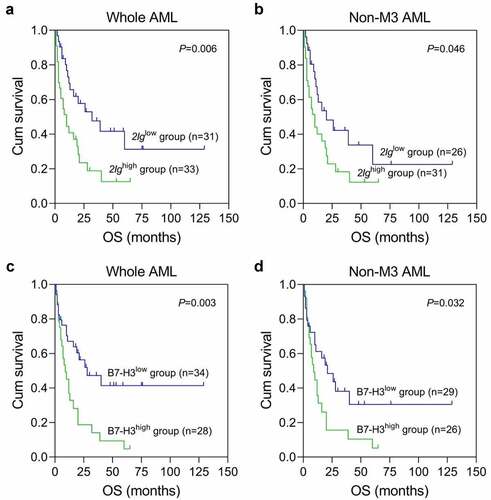
Table 4. Univariate and multivariate analysis of prognostic factors for overall survival in de novo AML patients
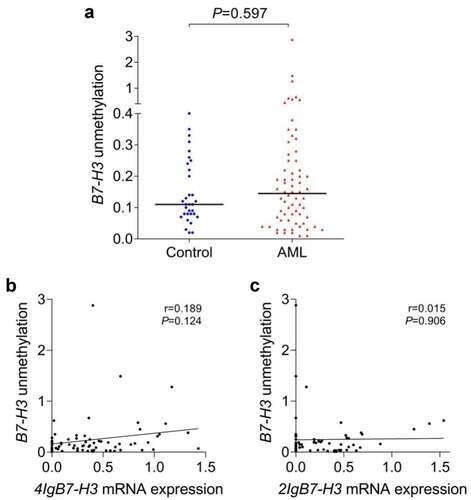
Figure 8. B7-H3 unmethylation level and its correlation with the mRNA expression of B7-H3 isoforms in de novo AML patients. (a) B7-H3 unmethylation level in AML patients and controls. (b-c) Correlation between B7-H3 promoter unmethylation level and the mRNA expression of 4Ig B7-H3 and 2Ig B7-H3 in AML patients