
Figures & data
Figure 1. Effect of PSP on the survival, apoptosis, and inflammation of L6 myotubes. (a) The effect of different PSP concentrations on the cell survival of L6 myotubes as assessed by CCK8 assay (*P < 0.05, **P < 0.01, ***P < 0.001 vs. 0 μg/mL). (b) The effect of different PSP concentrations on the apoptosis of L6 myotubes as assessed by Flow Cytometer. (c) The levels of IL-1β, IL-6, and TNF-α in the cell supernatant as measured by ELISA. PSP: Polygonatum sibiricum polysaccharide; PA: palmitic acid; CCK8: Cell Counting Kit-8
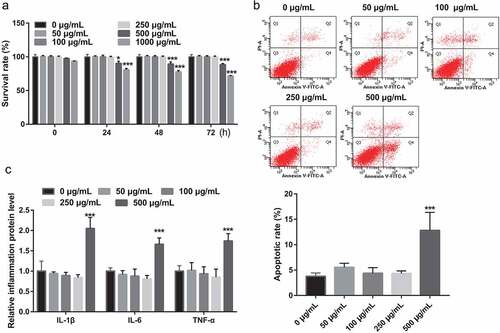
Figure 2. PSP improves the survival, glucose and TG metabolism, and inflammation in the PA-treated L6 myotubes. (a) The effect of PSP on the survival of the PA-treated L6 myotubes. (b) The glucose concentration in the L6 myotubes supernatant were measured by glucose detect kit after stimulated with 100 nM insulin after treatment 48 h. Glucose uptake efficiency was negatively correlated with glucose concentration in the supernatant. (c) The GLUT-4 expression in L6 myotubes as measured by qRT-PCR. (d) The effects of PSP on lipid accumulation as assessed by Oil Red O staining (left, ×400). The TG concentration in the L6 myotubes as measured by TG detect kit after treatment for 48 h (right). (e) The levels of IL-1β, IL-6, and TNF-α in the cell supernatant as measured by ELISA. ###P < 0.001, control vs PA model group; **P < 0.01 and ***P < 0.001, treatment group vs PA group. PSP: Polygonatum sibiricum polysaccharide; PA: palmitic acid; TG: triglyceride
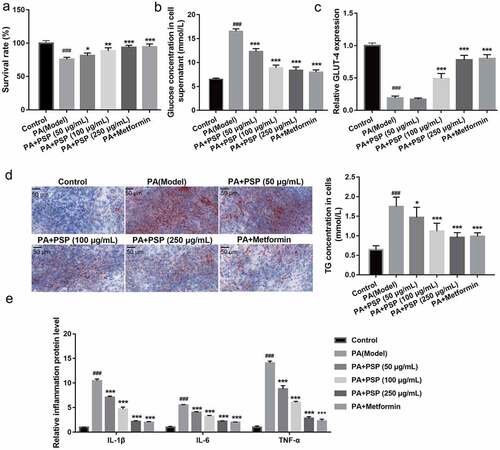
Figure 3. The effects of PSP on miRNAs expression in the PA-treated L6 myotubes. (a) miRNAs expression in control and PA-treated L6 myotubes as measured by qRT-PCR. ***P < 0.001. (b-d) rno-miR-340-3p (b), rno-miR-425 (c), and rno-miR-675 (d) expression as measured by qRT-PCR after PSP treatment of PA-treated L6 myotubes. **P < 0.01 and ***P < 0.001, treatment group vs PA group. PSP: Polygonatum sibiricum polysaccharide; PA: palmitic acid
Figure 4. miR-340-3p expression is inhibited after transfection with miR-340-3p inhibitor, whereas it is promoted after transfection with miR-340-3p mimic
Figure 5. Overexpression of miR-340-3p reverses the effects of PSP on survival and glucose and TG metabolism in the insulin-resistant L6 myotubes. (a) The survival of PA-treated L6 myotubes as assessed by CCK8 assay after transfection with miR-340-3p mimic and inhibitor for 48 h. (b) The glucose concentration in the L6 myotubes supernatant as measured by glucose detect kit after stimulation with 100 nM insulin and after transfection with miR-340-3p mimic and inhibitor at 48 h. Glucose uptake efficiency was negatively correlated with glucose concentration in the supernatant. (c) The GLUT-4 expression in L6 myotubes as measured by qRT-PCR. (d) The effects of PSP on lipid accumulation as assessed by Oil Red O staining (left, ×400). The TG concentration in the L6 myotubes were measured by TG detect kit after treatment for 24 h (right). (e) The levels of IL-1β, IL-6, and TNF-α in the cell supernatant as measured by ELISA. ***P < 0.001. TG: triglyceride; PSP: Polygonatum sibiricum polysaccharide; PA: palmitic acid; NC: negative control; CCK8: Cell Counting Kit-8; NC: negative control
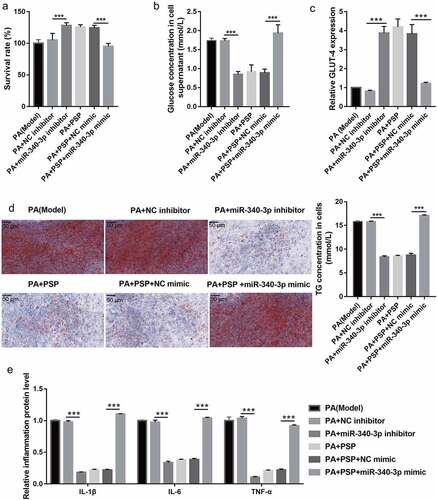
Figure 6. PSP treatment regulates IRAK3 expression in PA-treated L6 myotubes. (a) The target genes were analyzed by targetscan 7.0, miRDB, and miRwalk. (b) 12 mRNA intersections were found between 1885 downregulated mRNA in GSE29221 database and 117 potential target genes. (c) the binding between miR-340-3p and IRAK3 3′-UTR as analyzed by Luciferase reporter assay. (d) IRAK3 mRNA expression as measured by qRT-PCR. (e) IRAK3 protein level as measured by Western blot. ###P < 0.001 vs control group; ***P < 0.001 vs model group
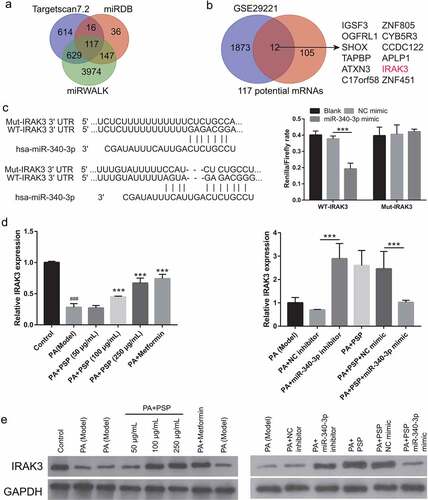
Figure 7. Illustration of mechanistic action of PSP in L6 skeletal muscle cells. PA stimulation significantly suppressed cell survival and glucose uptake while increased lipid accumulation and inflammation in L6 myotubes. PSP improve the PA effect in skeletal muscle cells by inhibiting miR-340-3p/IRAK3 axis
Supplemental Material
Download Zip (368.2 KB)Availability of Data and Materials
All data during the study appear in the submitted article.