Figures & data
Table 1. Primer sequences for RT-qPCR
Figure 1. Knockdown of circSLC7A6 inhibits WT progression. (a) RT-qPCR showed the relative expression of circSLC7A6 in WT tissues and adjacent normal tissues (n = 32). (b) RT-qPCR showed the relative expression of circSLC7A6 in WT cell lines (HFWT, WiT49, and 17–94) and normal renal tubular epithelial cell line (HK-2). (c) RT-qPCR showed the relative expression of circSLC7A6 in HFWT and 17–94 transfected with shNC and shcircSLC7A6. (d) CCK-8 assay showed the cell viability of HFWT and 17–94 cells transfected with shNC and shcircSLC7A6. (e) Wound healing assay revealed the cell migration of HFWT and 17–94 cells transfected with shNC and shcircSLC7A6. (f) Transwell assay indicated the cell invasion of HFWT and 17–94 cells transfected with shNC and shcircSLC7A6. (g) Flow cytometry assay showed the cell apoptosis of HFWT and 17–94 cells transfected with shNC and shcircSLC7A6. *p < 0.05, **p < 0.001, and ***p < 0.0001.
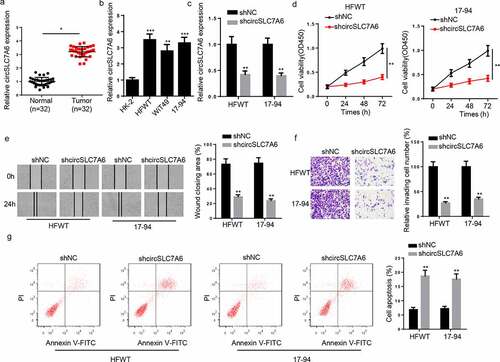
Figure 2. Silencing of circSLC7A6 represses WT tumor growth in vivo. (a-c) Xenograft experiment showed that knockdown of circSLC7A6 reduced the volume and weight of tumors in mice. (d) IHC assay showed the Ki67 expression in shcircSLC7A6 and shNC group. *p < 0.05.
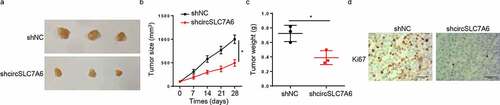
Figure 3. CircSLC7A6 targets miR-107 in WT cells. (a) The binding site between circSLC7A6 and miR-107 was predicted by starBase website. (b) Luciferase reporter assay was performed to testify the interaction between circSLC7A6 and miR-107 in HFWT and 17–94 cells. (c) RIP assay was performed to determine the enrichment of circSLC7A6 and miR-107 in anti-IgG and anti-Ago2. (d) RT-qPCR showed the relative expression of miR-107 in WT tissues and adjacent normal tissues (n = 32). (e) RT-qPCR showed the relative expression of miR-107 in WT cell lines (HFWT, WiT49, and 17–94) and normal renal tubular epithelial cell line (HK-2). (f) Pearson’s correlation analysis was used to analyze the correlation between circSLC7A6 and miR-107 expression in WT tissues. (g) RT-qPCR was employed to assess miR-107 expression in HFWT and 17–94 cells transfected with shNC and shcircSLC7A6. *p < 0.05 and **p < 0.001.
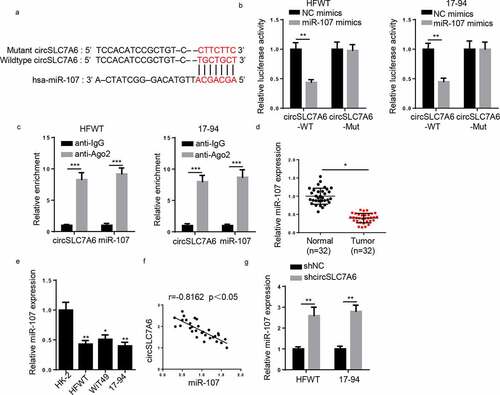
Figure 4. CircSLC7A6 positively regulates WT progression by sponging miR-107. (a-d) CCK-8, wound healing, transwell and flow cytometry assays showed the cell viability, migration, invasion, and apoptosis of WT cells transfected with shNC, shcircSLC7A6, and shcircSLC7A6+ miR-107 inhibitor. *p < 0.05, **p < 0.001, and ***p < 0.0001.
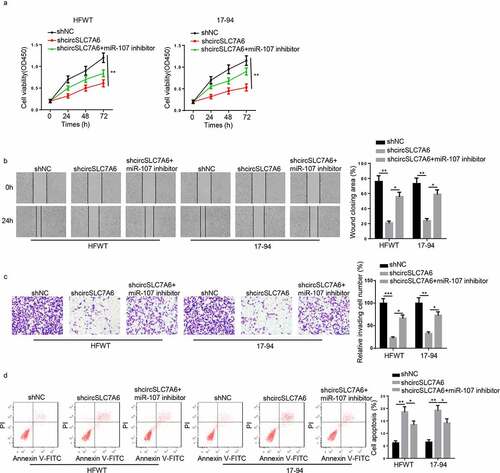
Figure 5. ABL2 is a downstream gene of miR-107. (a)StarBase website predicted the binding site between ABL2 and miR-107. (b) Luciferase reporter assay was performed to testify the interaction between ABL2 and miR-107 in HFWT and 17–94 cells. (c and d) RT-qPCR showed ABL2 expression in WT tissues (n = 32) and cell lines. (e) Pearson’s correlation analysis was used to analyze the correlation between ABL2 and miR-107 expression in WT tissues. (f) RT-qPCR was employed to assess ABL2 expression in WT cells transfected with NC mimics, miR-107 mimics and miR-107 mimics+circSLC7A6. *p < 0.05 and **p < 0.001.
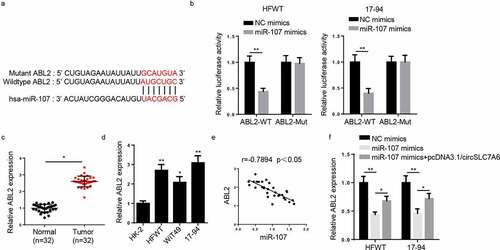
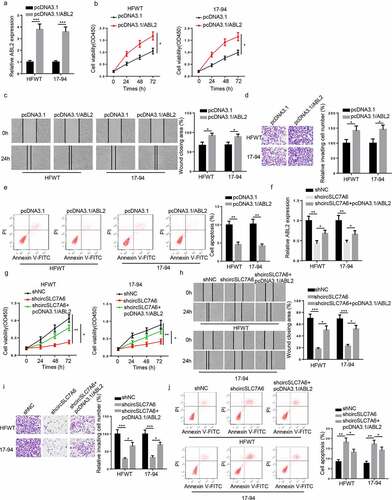
Figure 6. CircSLC7A6 knockdown suppresses the tumorigenesis of WT through regulating ABL2. (a) RT-qPCR showed the expression of ABL2 in HFWT and 17–94 cells transfected with pcDNA3.1 and pcDNA3.1/ABL2. (b-e) CCK-8, wound healing, transwell, and flow cytometry assays showed the cell viability, migration, invasion, and apoptosis of HFWT and 17–94 cells transfected with pcDNA3.1 and pcDNA3.1/ABL2. (f) RT-qPCR analysis showed the relative expression of ABL2 in HFWT and 17–94 cells transfected with shNC, shcircSLC7A6, shcircSLC7A6 + pcDNA3.1/ABL2. (g-j) CCK-8, wound healing, transwell, and flow cytometry assays were adopted to evaluate the cell viability, migration, invasion, and apoptosis of HFWT and 17–94 cells transfected with shNC, shcircSLC7A6, and shcircSLC7A6 + pcDNA3.1/ABL2. *p < 0.05, **p < 0.001, and ***p < 0.0001.