
Figures & data
Figure 1. Nesfatin-1 improved cell viability in HG/HL-induced HTR-8/SVneo cells (a-b) HTR-8/SVneo cells were treated with high glucose (HG; 25 mM glucose) or/and high lipid (HL; 0.4 mM palmitic acid). The protein expression of nesfatin-1 was detected using Western blot. (c) HTR-8/SVneo cells were treated with HG or/and HL, or pre-incubated with Nesfatin-1 (1, 2, 5, 10 and 20 nM) for 2 h prior to HG/HL stimulation. Then, cell viability of each group was measured using CCK-8 assay. (d) The cytotoxicity was evaluated by detecting the LDH leakage in to the culture medium. Data were expressed as the mean ± SD. N = 3. *p < 0.05, **p < 0.01, ***p < 0.001
Figure 2. Nesfatin-1 lowered inflammatory response and oxidative stress in HG/HL-induced HTR-8/SVneo cells (a-c) HTR-8/SVneo cells were treated with HG or/and HL, or pre-incubated with Nesfatin-1 for 2 h prior to HG/HL stimulation. Then, the production of TNF-α, IL-6 and IL-1β in culture medium was assess using their corresponding ELISA kits. (d-f) The levels of MDA, SOD and CAT were elevated by their corresponding commercial kits. Data were expressed as the mean ± SD. N = 3. ***p < 0.001
Figure 3. Nesfatin-1 reduced mitochondrial apoptosis in HG/HL-induced HTR-8/SVneo cells (a) HTR-8/SVneo cells were treated with HG or/and HL, or pre-incubated with Nesfatin-1 for 2 h prior to HG/HL stimulation. Cell apoptosis was assessed by TUNEL assay. (b) The protein expression of Bcl-2, Bax, Cleaved caspase 3 and cleaved caspase 9 was detected using Western blot. (c-d) The content of cytochrome C in mitochondria and cytoplasm is evaluated using Cytochrome c Assay Kit. (e) The ATP level in culture supernatants were detected using ATP Assay Kit. (f-g) The mRNA level of Nuclear respiratory factor 1 (NRF1) and mitochondrial transcription factor A (TFAM) was determined by qRT-PCR. Data were expressed as the mean ± SD. N = 3. *p < 0.05, **p < 0.01, ***p < 0.001
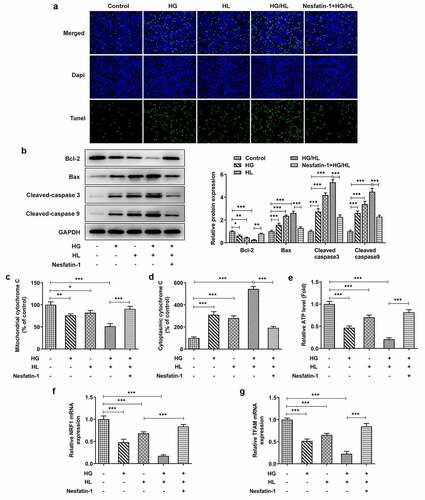
Figure 4. Nesfatin-1 inhibited p38 MAPK signaling in HG/HL-induced HTR-8/SVneo cells HTR-8/SVneo cells were treated with HG or/and HL, or pre-incubated with Nesfatin-1 for 2 h prior to HG/HL stimulation. The protein expression of p-p38 and p38 was evaluated using Western blot. Data were expressed as the mean ± SD. N = 3. ***p < 0.001
Figure 5. P79350 treatment erased the effects of nesfatin-1 on cell viability, inflammatory response and oxidative stress in HG/HL-induced HTR-8/SVneo cells (a) HTR-8/SVneo cells were treated with HG/HL, or pre-incubated with Nesfatin-1 with or without p79350 for 2 h prior to HG/HL stimulation. Cell viability was measured using CCK-8 assay. (b) The cytotoxicity was evaluated by detecting the LDH leakage in to the culture medium. (c-e) The production of TNF-α, IL-6 and IL-1β in culture medium was assess using their corresponding ELISA kits. (f-h) The levels of MDA, SOD and CAT were elevated by their corresponding commercial kits. Data were expressed as the mean ± SD. N = 3. *p < 0.05, **p < 0.01, ***p < 0.001
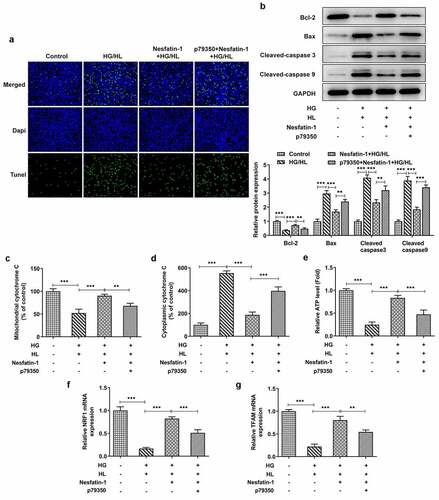
Figure 6. P79350 treatment erased the effects of nesfatin-1 on cell apoptosis and mitochondrial dysfunction in HG/HL-induced HTR-8/SVneo cells (a) HTR-8/SVneo cells were treated with HG/HL, or pre-incubated with Nesfatin-1 with or without p79350 for 2 h prior to HG/HL stimulation. Cell apoptosis was assessed by TUNEL assay. (b) The protein expression of Bcl-2, Bax, Cleaved caspase 3 and cleaved caspase 9 was detected using Western blot. (c-d) The content of cytochrome C in mitochondria and cytoplasm is evaluated using Cytochrome c Assay Kit. (e) The ATP level in culture supernatants were detected using ATP Assay Kit. (f-g) The mRNA level of Nuclear respiratory factor 1 (NRF1) and mitochondrial transcription factor A (TFAM) was determined by qRT-PCR. Data were expressed as the mean ± SD. N = 3. **p < 0.01, ***p < 0.001
Availability of Data and Materials
All data generated or analyzed during this study are included in this published article.