
Figures & data
Figure 1. Screening of DEGs associated with chemotherapeutic relapse from TCGA. (a) Venn plots analyzed the DEGs in cervical cancer from TCGA. Red: increased DEGs, blue: decreased DEGs. (b) WGCNA cluster analysis of DEGs significantly associated with chemotherapeutic relapse. (c) Function and pathway enrichment analysis of ITM2A in the green-module gene set in WGCNA. (d) Protein–protein interaction network of differential genes was determined by STRING
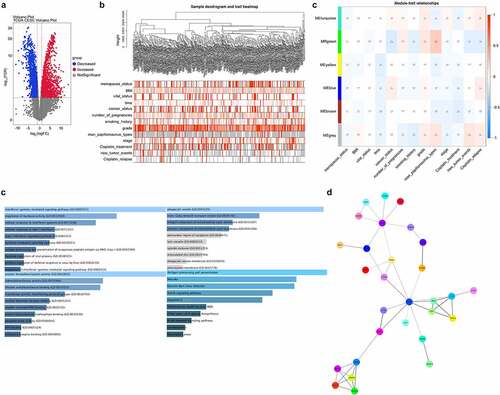
Figure 2. The expression of ITM2A was significantly downregulated in patients with recurrent cervical cancer after clinical cisplatin treatment. (a) mRNA expression of ITM2A was analyzed in TCGA. ***P < 0.001. (b) Kaplan–Meier curve analyzed the relationship between ITN2A expression and survival rate (including OS: overall survival, DSS: disease-specific survival, PFI: progress-free interval) in recurrence cases after treatment with cisplatin. (c) Representative images of immunohistochemical staining of ITM2A in normal and tumor tissues. (d&e) The expression of ITM2A in normal and tumor tissues was determined by RT-qPCR (d) and western blotting (e). Error bars represent data from three independent experiments (mean ± SD). **P < 0.01
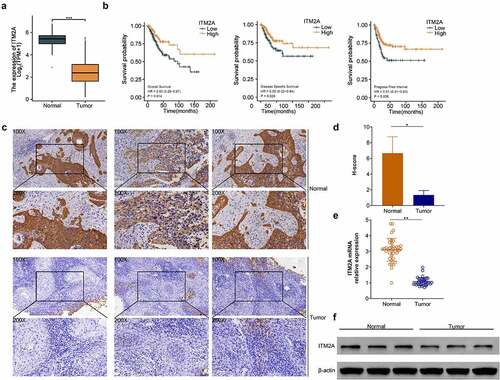
Figure 3. The expression of ITM2A was significantly downregulated in cisplatin-resistant cervical cancer cells. (a) RT-qPCR was used to measure the expression of drug-resistance-related genes in naive cells and cisplatin cells of Hela and SIHA. (b&c) The expression of drug-resistance-related proteins in naive cells and cisplatin cells of Hela (b) and SIHA (c) was determined by western blotting. (d) Morphology of parent cells and PTX resistance cells in MDA-MB231 and MDA-MB436 was measured by microscopy. Error bars represent data from three independent experiments (mean ± SD). *P < 0.05, **P < 0.01
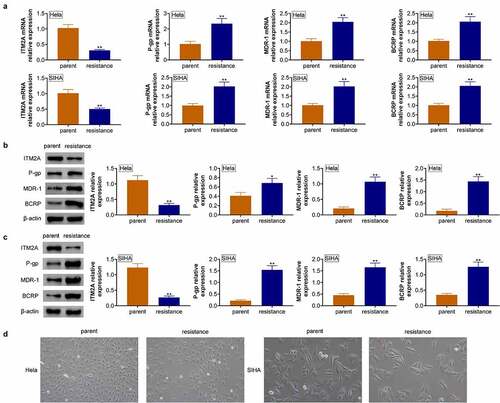
Figure 4. Overexpression of ITM2A increases the cisplatin sensitivity of cervical cancer cells. (A&B) Overexpression of ITM2A in cisplatin-resistant SIHA cells was confirmed by RT-qPCR (a) and western blotting (b). (C&D) Knockdown of ITM2A in cisplatin-resistant SIHA cells was confirmed by RT-qPCR (c) and western blotting (d). (e) SIHA cisplatin-resistant cell lines were transfected with indicated plasmids, after treated with different concentration of cisplatin for 72 h, cell viability was measured by MTT assay. (F&G) Clonogenic assay was performed to measure the capacity of foci formation in SIHA cisplatin-resistant cells treated with empty-vector and ITM2A-vector. (H&I) Clonogenic assay was performed to measure the capacity of foci formation in SIHA cisplatin-resistant cells treated with si-ITM2A and si-ctrl. Results presented represent the means of triplicate experiments ± SEM. **P < 0.01
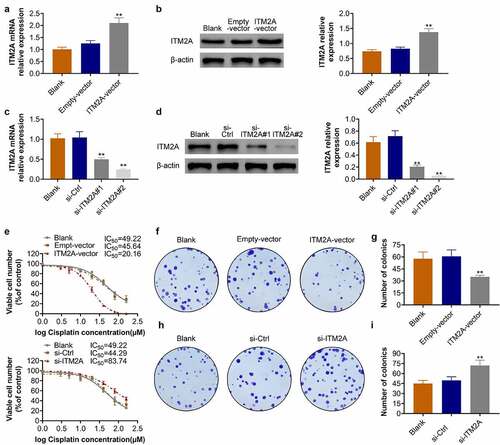
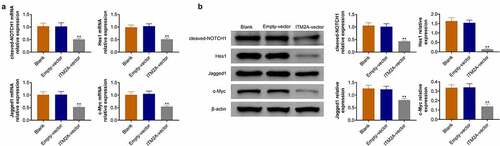
Figure 5. ITM2A regulates chemotherapeutic drug sensitivity through the Notch pathway. (a) The mRNA expression of Notch signaling pathway related genes in ITM2A overexpression cells were measured by RT-qPCR. (b) Western blotting was used to analysis the expression of these protein in ITM2A overexpression cells. Results presented represent the means of triplicate experiments ± SEM. **P < 0.01
Availability of data and materials
All data generated or analyzed during this study are included in this published article.