Figures & data
Figure 1. Effects of AZD3759 and osimertinib on the sensitivity of NSCLC cells to RA are evaluated using the clonogenic assay. (a) Survival fraction is determined after PC-9 cells are treated with different concentrations of osimertinib. (b) Survival fraction is determined after H3255 cells are treated with different concentrations of osimertinib. (c) Survival fraction is determined after PC-9 cells are treated with different concentrations of AZD3759. (d) The survival fraction was determined after H3255 cells were treated with different concentrations of AZD3759 (*p < 0.05 vs. control, **p < 0.01 vs. control). NSCLC, non-small cell lung cancer; RA, radiation.
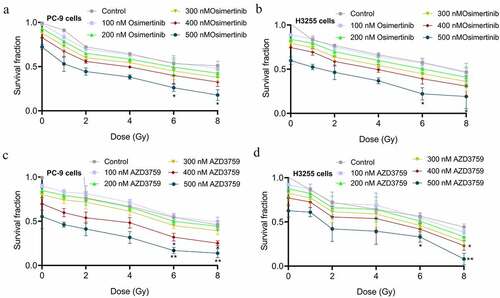
Figure 2. AZD3759 promoted the RA-induced apoptosis in NSCLC cells. (a) The apoptotic rate in PC-9 cells and H3255 cells treated with different strategies is evaluated using flow cytometry. (b) The cell cycle of PC-9 cells and H3255 cells treated with different strategies is evaluated using flow cytometry. (c) The expression level of caspase 3, caspase 3 (c), PPAR, and PPAR (C) is determined using Western blotting assay (*p < 0.05 vs. RA, **p < 0.01 vs. RA, & p < 0.05 vs. AZD3759 + RA, #p < 0.05 vs. AZD3759). NSCLC, non-small cell lung cancer; RA, radiation; caspase 3 (C), cleaved caspase 3; PRAR (C), cleaved PRAR.
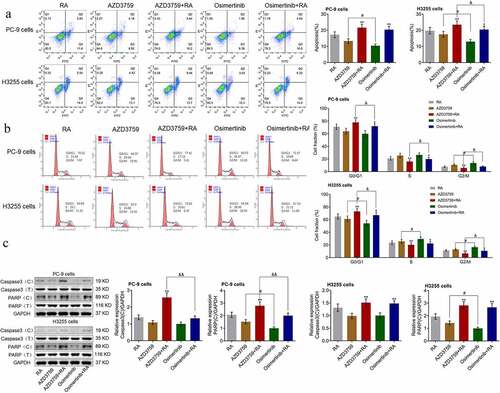
Figure 3. AZD3759 enhances the RA-induced DNA damage in NSCLC cells. DNA damage in PC-9 cells (a) and H3255 cells (b) is evaluated using the γ-H2AX immunofluorescence assay (*p < 0.05 vs. RA, **p < 0.01 vs. RA, &&p < 0.01 vs. AZD3759 + RA). NSCLC, non-small cell lung cancer; RA, radiation.
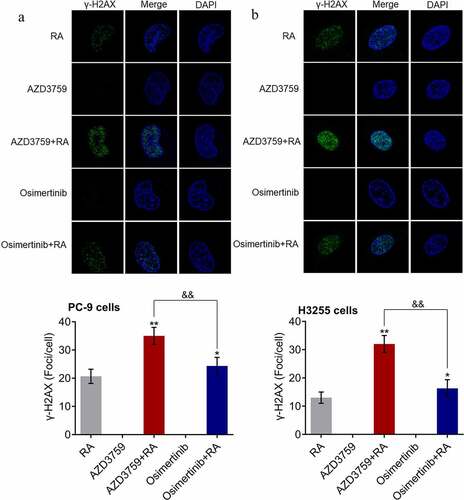
Figure 4. Fluorescence intensity is positively correlated with the number of PC-9 LUC cells. (a) Luciferin activity in PC-9-WT and PC-9-LUC cells is determined using the IVIS spectrum system (**p < 0.01 vs. PC-9-WT). (b) Photons of different number of PC-9-LUC cells are detected using the IVIS spectrum system. (c) The OD value of PC-9-WT and PC-9-LUC cells is measured using CCK-8 assay. (d) Cell cycle in PC-9-WT and PC-9-LUC cells is determined using flow cytometry assay. OD, optical density; WT, wild type.
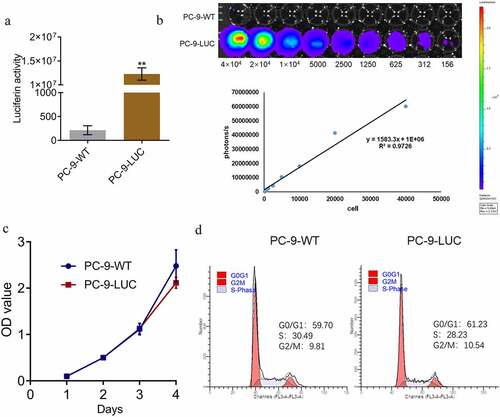
Figure 5. AZD3759 promotes the inhibitory effect of RA on the brain metastasis by PC-9 cells in xenograft mice. (a) Live imaging of the animals in each group is performed 1 week and 3 weeks post treatments. (b) Average signal levels are quantified using the IVIS spectrum system (*p < 0.05 vs. control, **p < 0.01 vs. control, ##p < 0.01 vs. RA, &p < 0.05 vs. AZD3759 + RA). (c) Tumor volumes are calculated at the end of the experiments (**p < 0.01 vs. control, ##p < 0.01 vs. RA, &p < 0.05 vs. AZD3759 + RA). RA, radiation.
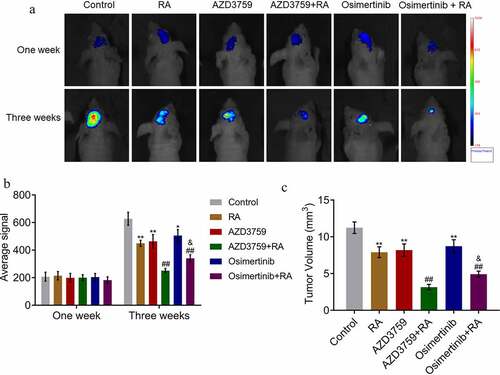
Figure 6. JAK1 overexpression abolishes effects of AZD3759 on clone formation and DNA damage in RA-treated PC-9 cells. (a) Effects of AZD3759 and osimertinib on RTK pathway activity are evaluated using the RTK signaling antibody array. (b) Transfection efficacy is confirmed using Western blotting assay. (c) Survival fraction is determined after PC-9 cells or JAK1-overexpressing PC-9 cells are treated with different concentrations of AZD3759 (*p < 0.05 vs. control, **p < 0.01 vs. control). (d) DNA damage is evaluated using the γ-H2AX immunofluorescence assay (**p < 0.01 vs. RA, ##p < 0.01 vs. AZD3759 + RA). JAK, Janus kinase 1; RA, radiation; RTK, receptor tyrosine kinase.
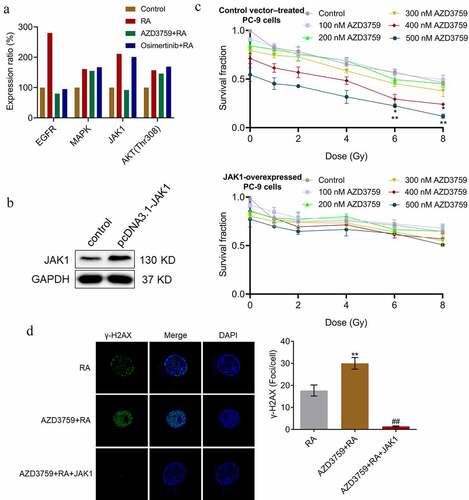
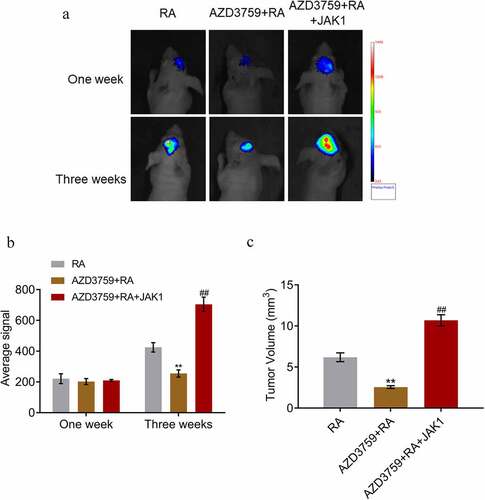
Figure 7. JAK1 overexpression abolishes effects of AZD3759 on the brain metastasis by PC-9 cells in RA-treated nude mice. (a) Live imaging of the animals in each group is performed 1 week and 3 weeks post treatments. (b) Average signal levels are quantified using the IVIS spectrum system (**p < 0.01 vs. RA, ##p < 0.01 vs. AZD3759 + RA). (c) Tumor volumes are calculated at the end of the experiments (**p < 0.01 vs. RA, ##p < 0.01 vs. AZD3759 + RA).