Figures & data
Table 1. The relationship between RRM2 and clinical parameters
Figure 1. RRM2 is highly expressed in RB cancer tissues and cells. (a) Volcano plot of differential gene expression from GSE97508 data in Gene Expression Omnibus database. (b) Expression level of RRM2 using data from GSE97508 data.(c) The difference of RRM2 protein expression in retinoblastoma (RB) and normal retina tissues was detected by Western blot. (d) The difference of RRM2 mRNA expression in RB samples (n = 46) and normal retina tissue (n = 20) was detected by RT-qPCR. (e) The difference of RRM2 mRNA expression between metastatic RB and non-metastatic RB was detected by RT-qPCR. (f) The protein expression of RRM2 in human RB cell lines Y79, WERI-Rb1 and normal retinal cell line ARPE-19 was detected by Western blot. (g) The median expression value of RRM2 in 46 cases of RB patients was used as the cutoff value to divide into high and low expression group. The relationship between RRM2 expression level and the overall survival rate of RB patients was analyzed by Kaplan Meier Curve and log-rank test. Three independent assays of RT-qPCR were performed with three technical replicates. *, P < 0.05, **, P < 0.01, and ***, P < 0.001
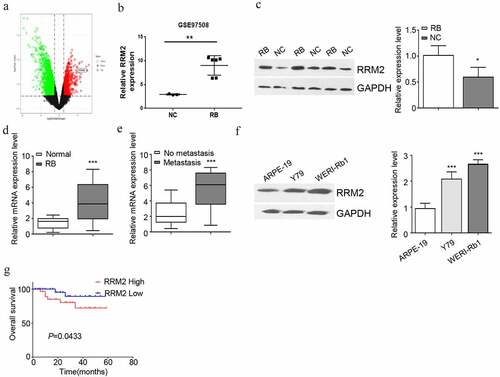
Figure 2. Interfering with the expression of RRM2 decreased the proliferation, EMT migration and invasion of Rb cells. (a) The silencing efficiency of RRM2 in RB cells Y79 and WERI-Rb1 was assessed by Western blot. B The light absorption value of Y79 and WERI-Rb1 cells at 450 nm wavelength was detected by CCK8 assay. (c) The colony forming ability of Y79 and WERI-Rb1 cells with different treatments was evaluated by colony forming assay. (d) and (e) The migration (d) and invasion (e) ability of Y79 and WERI-Rb1 cells with indicated treatment was examined by Transwell assay. (f) The expression levels of EMT-related proteins (snail1, E-cadherin and N-cadherin) in Y79 and WERI-Rb1 cells were detected by Western blot. Three independent assays were performed. *, P < 0.05, **, P < 0.01, and ***, P < 0.001
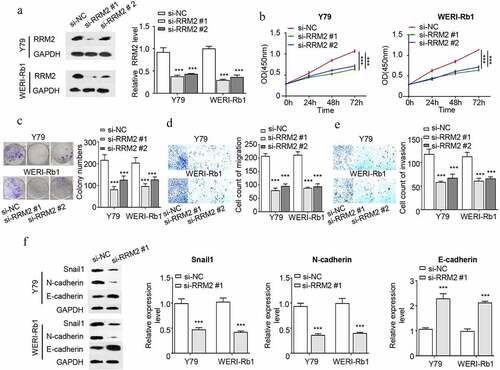
Figure 3. Overexpression of RRM2 enhances the proliferation, migration and invasion and EMT of RB cells. (a) The overexpression efficiency of RRM2 in Y79 and WERI-Rb1 cells was detected by Western blot. (b) The changes in the proliferation ability of Y79 and WERI-Rb1 cells after overexpressing RRM2 was analyzed by CCK8. (c) The clonogenic ability of Y79 and WERI-Rb1 cells after overexpressing RRM2 was detected by the colony forming assay. (d) and (e) The changes in migration (d) and invasion (e) ability of Y79 and WERI-Rb1 cells after RRM2 overexpression were examined by Transwell assay. (f) The changes in the protein levels of EMT-related proteins (snail1, E-cadherin and N-cadherin) after overexpression of RRM2 were detected by Western blot. Three independent assays were performed. *, P < 0.05, **, P < 0.01, and ***, P < 0.001
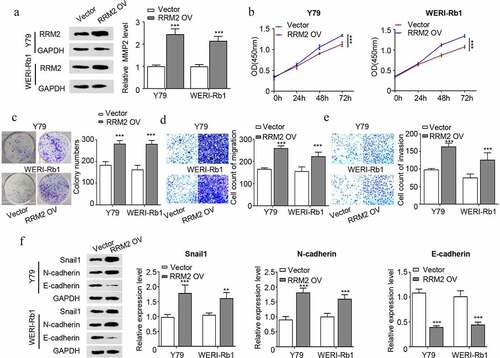
Figure 4. RRM2 regulates proliferation, invasion and EMT via the JAK2/STAT3 pathway in retinoblastoma cells. (a) The protein levels of JAK2/STAT3 pathway molecules (JAK2, p-JAK2, STAT3 and p-STAT3) in Y79 and WERI-Rb1 cells after RRM2 silencing by Western blot. B. The protein levels of JAK2/STAT3 pathway molecules were detected after RRM2 overexpression. JAK2 inhibitor INCB (5 µM) was used to inhibit the JAK2/STAT3 signaling pathway. C. The CCK8 proliferation assay was used to detect the proliferation ability after different treatments. D. The clonogenic ability of cells were evaluated by colony forming assay. E and F. The migration (d) and invasion (e) ability of Y79 and WERI-Rb1 cells were examined by Transwell assay. Three independent assays were performed. *, P < 0.05, **, P < 0.01, and ***, P < 0.001
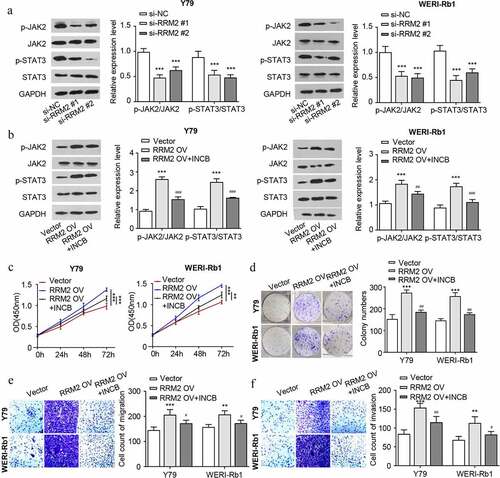
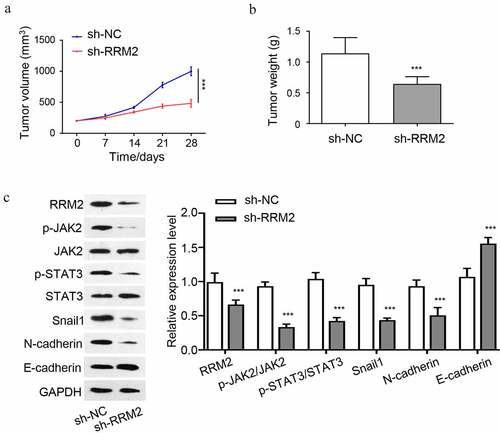
Figure 5. Knockdown of RRM2 inhibits the tumorigenesis of RB cells in nude mice. 1 × 10⁷ Y79 cells with stable RRM2 knockdown (sh-RRM2) or the control cells (sh-NC) were inoculated subcutaneously in nude mice. (a) The size of xenograft tumors was measured every 7 days. (b) The subcutaneous tumor weight of different groups (sh-NC and sh-RRM2) was measured at the end of the experiment. C. The protein levels of JAK2, p-jak2, STAT3, p-STAT3, RRM2, snail1, N-cadherin and E-cadherin in tumor samples of sh-NC and sh-RRM2 groups were detected by Western blot. *, P < 0.05, **, P < 0.01, and ***, P < 0.001