1,482
Views
11
CrossRef citations to date
0
Altmetric
Research Paper

Clinical value of lncRNA TUG1 in temporal lobe epilepsy and its role in the proliferation of hippocampus neuron via sponging miR-199a-3p

ORCID Icon, , &
Pages 10666-10673 | Received 23 Sep 2021, Accepted 31 Oct 2021, Published online: 07 Dec 2021

Figures & data

Table 1. Baseline characteristics of the subjects

Figure 1. Serum expression levels of TUG1 in children with temporal lobe epilepsy (TLE) and healthy controls. The expression of TUG1 in TLE children was significantly increased. *** P < 0.001, compared with the healthy individuals
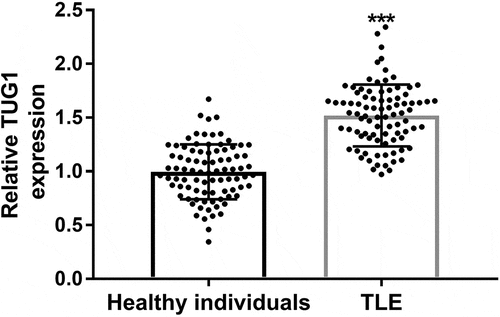
Figure 1. Serum expression levels of TUG1 in children with temporal lobe epilepsy (TLE) and healthy controls. The expression of TUG1 in TLE children was significantly increased. *** P < 0.001, compared with the healthy individuals

Figure 2. A receiver operating characteristic ROC curve was conducted to calculate the diagnostic ability of serum TUG1 for TLE. The area under the curve (AUC) for TUG1 was 0.915, with a sensitivity of 80.7% and specificity of 88.4% at the cutoff value of 1.256
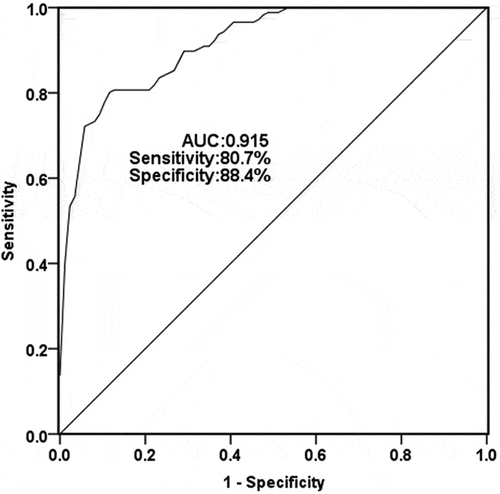
Figure 2. A receiver operating characteristic ROC curve was conducted to calculate the diagnostic ability of serum TUG1 for TLE. The area under the curve (AUC) for TUG1 was 0.915, with a sensitivity of 80.7% and specificity of 88.4% at the cutoff value of 1.256

Figure 3. Effect of TUG1 on cell viability and apoptosis of hippocampal neurons. (a) primary hippocampal cells of newborn rats were cultured in the magnesium-free medium for three hours to simulate the symptoms of TLE in children. High expression of TUG1 was observed in cells treated in the magnesium-free medium compared with the untreated cells. Transfection of si-TUG1 led to a remarkable decrease in the expression level of TUG1. (b) No Mg2+ treatment reduced the cell viability, but the cell viability was promoted by knocking out TUG1. (c) No Mg2+ treatment promoted cell apoptosis, however, knocking out TUG1 inhibited TLE – induced apoptosis. *** P < 0.001, compared with untreated group; ### P < 0.001, compared with no Mg2+ group

Figure 3. Effect of TUG1 on cell viability and apoptosis of hippocampal neurons. (a) primary hippocampal cells of newborn rats were cultured in the magnesium-free medium for three hours to simulate the symptoms of TLE in children. High expression of TUG1 was observed in cells treated in the magnesium-free medium compared with the untreated cells. Transfection of si-TUG1 led to a remarkable decrease in the expression level of TUG1. (b) No Mg2+ treatment reduced the cell viability, but the cell viability was promoted by knocking out TUG1. (c) No Mg2+ treatment promoted cell apoptosis, however, knocking out TUG1 inhibited TLE – induced apoptosis. *** P < 0.001, compared with untreated group; ### P < 0.001, compared with no Mg2+ group

Figure 4. MiR-199a-3p was a direct target of TUG1. (a) the binding site of TUG1 in miR-199a-3p. (b) miR-199a-3p mimic significantly inhibited the luciferase activity of WT 3 ‘-UTR of TUG1, while the luciferase activity of miR-199a-3p inhibitor was the opposite. Furthermore, the transfection of miR-199a-3p mimic or miR-199a-3p inhibitor did not affect luciferase activity in the mutant group. (c) compared with the control group, the expression level of miR-199a-3p was significantly decreased in the no Mg2+ group and significantly increased in the si-TUG1group. (d) the expression level of miR-199a-3p was significantly reduced in children with TLE compared with healthy individuals. (e) the expression of TUG1 in TLE children was negatively correlated with miR-199a-3p level (r = −0.7223, P < 0.0001). *** P < 0.001, compared with the untreated group, control group, or healthy individuals. ### P < 0.001, compared with No Mg2+ group
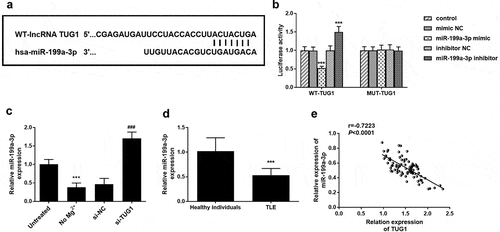
Figure 4. MiR-199a-3p was a direct target of TUG1. (a) the binding site of TUG1 in miR-199a-3p. (b) miR-199a-3p mimic significantly inhibited the luciferase activity of WT 3 ‘-UTR of TUG1, while the luciferase activity of miR-199a-3p inhibitor was the opposite. Furthermore, the transfection of miR-199a-3p mimic or miR-199a-3p inhibitor did not affect luciferase activity in the mutant group. (c) compared with the control group, the expression level of miR-199a-3p was significantly decreased in the no Mg2+ group and significantly increased in the si-TUG1group. (d) the expression level of miR-199a-3p was significantly reduced in children with TLE compared with healthy individuals. (e) the expression of TUG1 in TLE children was negatively correlated with miR-199a-3p level (r = −0.7223, P < 0.0001). *** P < 0.001, compared with the untreated group, control group, or healthy individuals. ### P < 0.001, compared with No Mg2+ group