
Figures & data
Table 1. Sequence of qPCR primers
Figure 1. Effect of p-CA on the polarization of mouse BMDM in vitro. A, 24 hours after being stimulated with p-CA (10, 50 and 100 μmol/L), LPS (100 ng/mL) and IFN-γ (20 ng/mL), qPCR analysis was used to detected the expression of M1 macrophages markers (TNF-α, IL-6, iNOS and CCL2) in BMDM; B, 24 hours after being stimulated with p-CA (10, 50 and 100 μmol/L) or IL-4 (20 ng/mL), qPCR analysis was used to detected the expression of M2 macrophages markers (IL-10, CD206, Arg1 and Mrc) in BMDM; C-D, 24 hours after being treated with different methods, BMDM were harvested to analyze M1 (CD86) (c) and M2 (CD206) (d) macrophages markers using flow cytometer. Data was expressed as (mean ± SD) from 3 independent tests, and P value was calculated by post-hoc comparisons in (a) and (b), and by student’s t test in (c) and (d). * was P < 0.05, ** was P < 0.01 and *** was P < 0.001 vs LPS+IFN-γ group
Figure 2. Inhibition of p-CA on LPS-induced M1 macrophage polarization by inhibiting IDO expression. A-C, after 24 hours of stimulation in different ways, BMDM were harvested to analyze IDO protein expression using Western blot, to analyze CD206 positive macrophage using flow cytometer, and to detect the expression of M2 macrophages markers (IL-10, CD206, Arg1 and Mrc) using qPCR. Data was expressed as (mean ± SD) from 3 independent tests, and P value was calculated by post-hoc comparisons in (a) and (b), and by student’s t test in (c)
Figure 3. Effect of p-CA on elevated IDO expression in the heart tissues caused by MI/R. A-B, we harvested the mouse heart tissues following 12 h, 24 h and 48 h of MI/R injury, and then analyze IDO gene expression using qPCR (a) and immunoblotting (b); C-E, mice were treated with100 mg/kg of p-CA prior to MI/R injury, and mouse heart tissues were harvest following 24 h of MI/R injury to be analyzed IDO gene expression using qPCR (c), immunoblotting (d) and immunochemistry (e) for studying the effect of p-CA on IDO expression in MI/R mice. Data was expressed as (mean ± SD) from 7 mice per group, and P value was calculated by post-hoc comparisons in (A) and (B), and by student’s t test in (C), (D) and (E). *** was P < 0.001 vs Sham group
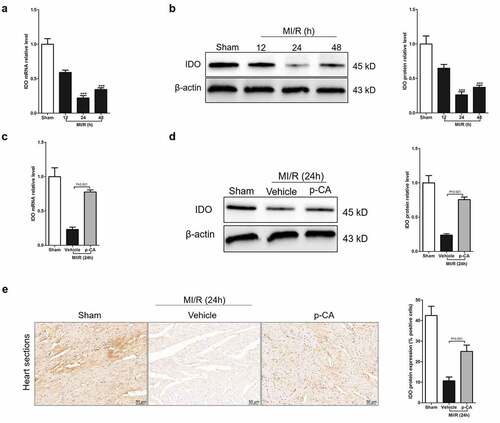
Figure 4. Effect of p-CA on macrophage polarization in the heart tissues caused by MI/R. A-B, 24 hours after MI/R injury, mice heart tissues were harvested to analysis M1 macrophages markers (iNOS and CCL2) (a) and M2 macrophages markers (CD206 and Arg1) (b) by qPCR; C-D, as described in (a and b), we prepared a single cell suspension of heart tissue, and used flow cytometer (c) to count the ratio of M1 macrophages (d) and M2 macrophages (e). Data was expressed as (mean ± SD) from 7 mice per group, and P value was calculated by student’s t test
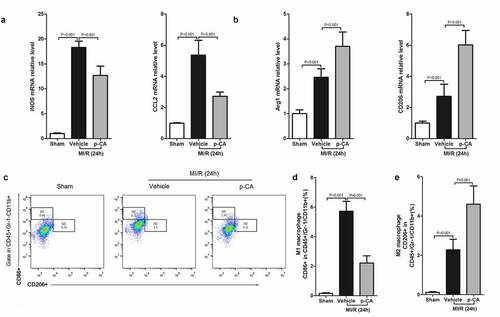
Figure 5. Effect of p-CA on inflammatory cytokines expression in the heart tissues caused by MI/R. A-D, 24 hours after MI/R injury, mice heart tissues were harvested to analysis TNF-α (a), IFN-γ (b), IL-4 (c) and IL-10 (d) by ELISA assay kit. Data was expressed as (mean ± SD) from 7 mice per group, and P value was calculated by student’s t test
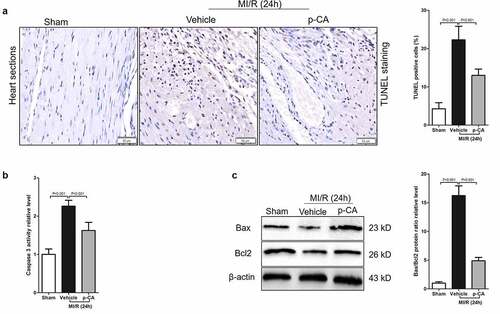
Figure 6. Effect of p-CA on cardiomyocyte apoptosis in the heart tissues caused by MI/R. A-C, 24 hours after MI/R injury, mice heart tissues were harvested to analysis cardiomyocyte apoptosis by TUNEL staining (a), to detect the caspase 3 activity by a kit (b), and to measure the expression of apoptosis-related proteins (Bax and Bcl2) by immunoblotting (c). Data was expressed as (mean ± SD) from 7 mice per group, and P value was calculated by student’s t test
Data availability statement
The data used to support the findings of this study are available from the corresponding author upon request.