Figures & data
Table 1. Primer sequences
Figure 1. Expression of miR-30a, Smad4, and TGF-β in serum of ovarian cancer patients treated with DDP. A–C, qRT-PCR was used to detect the relative expression level of miR-30a (a) Smad4 (b) and TGF-β (c)
Figure 2. Autophagy promotes DDP resistance in ovarian cancer cells. (a) CCK-8 assay was performed to detect the cell viability of A2780 and A2780-DDP cells. **P < 0.01 vs. A2780 group. (b) The protein expression of LC3I/II and Beclin1 were measured by western blotting; (c) CCK-8 assay was used to detect the cell viability; 3-MA, autophagy inhibitor; RAPA, autophagy activator rapamycin; **P < 0.01 vs. Blank control group; #P < 0.05 vs. 3-MA group; &P < 0.05 vs. RAPA group
Figure 3. Expression of miR-30a, TGF-β, and Smad4 in DDP drug-resistant cells. (a) The miR-30a expression in A2780-DDP and A2780 cells was detected using qRT-PCR. (b) Western blotting was used to determine the protein expression of Smad4 and TGF-β in A2780 and A2780-DDP cells. (c) qRT-PCR was used to measure the mRNA expression of Smad4 and TGF-β. Compared with the blank control group, *P < 0.05 and **P < 0.01 vs. Control group; #P < 0.05 and ##P < 0.01 vs. DDP in A2780
Figure 4. MiR-30a inhibits Smad4 and TGF-β expression in DDP drug-resistant cells. (a) TargetScan analysis indicated that there was a base complement site in miR-30a and Smad4 gene. (b) qRT-PCR detection of miR-30a expression after transfection with miR-30a mimics or mimics NC. **P < 0.01 vs. negative control group. (c) Western blotting was used to determine the protein expression of Smad4 and TGF-β in A2780 and A2780-DDP cells
Figure 5. miR-30a suppressed autophagy by regulation of TGF-β/Smad4 signaling pathway. (a-b) MDC staining was detected by flow cytometry, **P < 0.01 vs. Blank control group; #P < 0.05 vs. DDP group; &P < 0.05 vs. miR-30a group. (c) Western blotting detected the expression of autophagy-related proteins (LC3II and Beclin1) and TGF-β/Smad4 pathway proteins
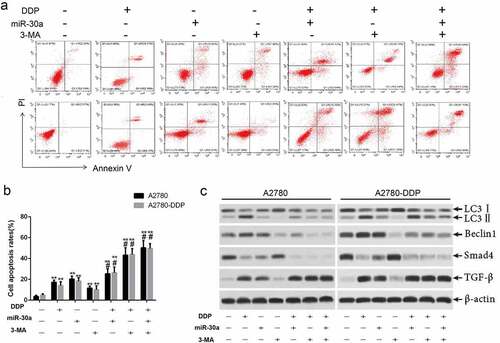
Figure 6. Over-expression of miR-30a suppressed autophagy and promoted DDP-induced apoptosis by inhibition of TGFβ/Smad4 signaling pathway. (a-b) Cells apoptosis was detected by flow cytometry. **P < 0.01 vs. The first group; #P < 0.05 vs. DDP group. (c) Western blotting was used to detect the expression of TGF-β, LC3II, Beclin1, and Smadf4 in A2780 and A2780-DDP cells