Figures & data
Figure 1. CENPU was upregulated in gastric cancer. (a) GEPIA showed that CENPU was upregulated in gastric cancer cells. (b) qPCR was used to detect the relative expression level of CENPU in human gastric epithelial cell line GES-1, and in gastric cancer cell lines AGS, MKN45, HGC-27. **p < 0.01 vs GES-1, ***p < 0.001 vs GES-1. Data are mean ± SEM of at least three independent experiments. (c) Left, representative blots of WB analysis of CENPU protein expression level in human gastric epithelial cell line GES-1, and in gastric cancer cell lines AGS, MKN45, HGC-27. Right, the relative protein expression level of CENPU normalized to GAPDH. **p < 0.01 vs GES-1, ***p < 0.001 vs GES-1. Data are mean ± SEM of at least three independent experiments
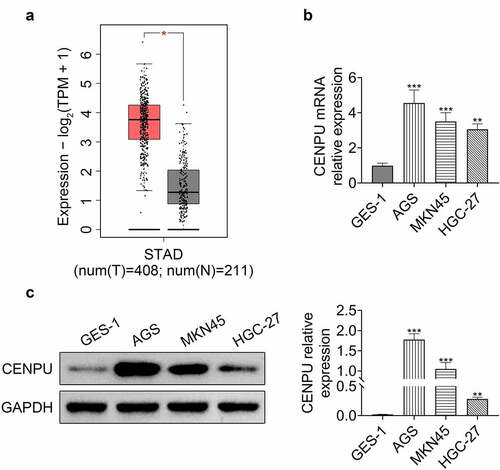
Figure 2. Knockdown of CENPU inhibited proliferation of gastric cancer cells. (a) Left, representative blots of WB analysis of CENPU protein expression level after transfections with si-CENPU and pcDNA-CENPU. Right, the relative protein expression level of CENPU normalized to GAPDH. ***p < 0.001 vs si-NC, ##p < 0.01 vs pcDNA. Data are mean ± SEM of at least three independent experiments. (b) MTT assay was used to assess the cell proliferation after transfection with si-CENPU and pcDNA-CENPU in AGS cells. **p < 0.01 vs si-NC, #p < 0.05 vs pcDNA. Data are mean ± SEM of at least three independent experiments. (c) Left, representative images of cell colony formation after transfections with si-CENPU and pcDNA-CENPU. Right, the average number of colonies in each dish of at least three independent experiments after transfection with si-CENPU and pcDNA-CENPU in AGS cells. **p < 0.01 vs si-NC, ##p < 0.01 vs pcDNA
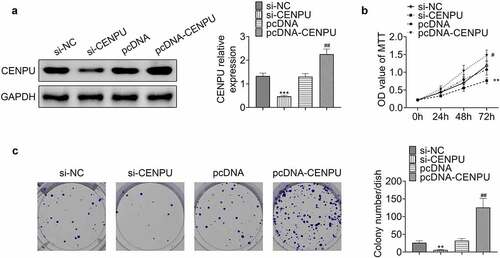
Figure 3. Knockdown of CENPU inhibited glycolysis of gastric cancer cells. (a) Glucose consumption was detected by glucose assay kit in AGS cells. ***p < 0.001 vs si-NC, ##p < 0.01 vs pcDNA. Data are mean ± SEM of at least three independent experiments. (b) Lactate production was assessed by lactate assay kit in AGS cells. ***p < 0.001 vs si-NC, #p < 0.05 vs pcDNA. Data are mean ± SEM of at least three independent experiments. (c) Total ATP content was measured by ATP assay kit. ***p < 0.001 vs si-NC, #p < 0.05 vs pcDNA. Data are mean ± SEM of at least three independent experiments. (d) Left, representative blots of WB analysis of LDHA, GLUT1 and HK2 protein expression levels after transfections with si-CENPU and pcDNA-CENPU. Right, the relative protein expression levels of LDHA, GLUT1 and HK2 normalized to GAPDH. ***p < 0.001 vs si-NC, ##p < 0.01 vs pcDNA. Data are mean ± SEM of at least three independent experiments
Figure 4. CENPU promoted proliferation and glycolysis of gastric cancer cells via HMGB2. (a) Left, representative blots of lysate of normal tissue adjacent to the tumor and gastric cancer tissue from gastric cancer patient. n = 40. Right, correlation analysis of the protein expression levels of CENPU and HMGB2. (b) Upper, representative blots of WB analysis of HMGB2 protein expression level after transfections with si-CENPU and pcDNA-CENPU. Lower, the relative protein expression level of HMGB2 normalized to GAPDH. ***p < 0.001 vs si-NC, ##p < 0.01 vs pcDNA. Data are mean ± SEM of at least three independent experiments. (c) MTT assay was used to assess the cell proliferation after transfection with si-CENPU and pcDNA-HMGB2 in AGS cells. **p < 0.01 vs si-NC, ##p < 0.01 vs si-CENPU. Data are mean ± SEM of at least three independent experiments. (d) Left, representative images of cell colony formation after transfections with si-CENPU and pcDNA-HMGB2 in AGS cells. Right, the average number of colonies in each dish of at least three independent experiments after transfection with si-CENPU and pcDNA-CENPU in AGS cells. **p < 0.01 vs si-NC, ##p < 0.01 vs si-CENPU. (e) Glucose consumption was detected by glucose assay kit in AGS cells. ***p < 0.001 vs si-NC, ##p < 0.01 vs si-CENPU. Data are mean ± SEM of at least three independent experiments. (f) Lactate production was assessed by lactate assay kit in AGS cells. **p < 0.01 vs si-NC, ##p < 0.01 vs si-CENPU. Data are mean ± SEM of at least three independent experiments. (g) Total ATP content was measured by ATP assay kit. **p < 0.01 vs si-NC, ##p < 0.01 vs si-CENPU. Data are mean ± SEM of at least three independent experiments. (h) Left, representative blots of WB analysis of LDHA, GLUT1 and HK2 protein expression levels after transfections with si-CENPU and pcDNA-HMGB2 in AGS cells. Right, the relative protein expression levels of LDHA, GLUT1 and HK2 normalized to GAPDH. **p < 0.01 vs si-NC, ##p < 0.01 vs si-CENPU. Data are mean ± SEM of at least three independent experiments
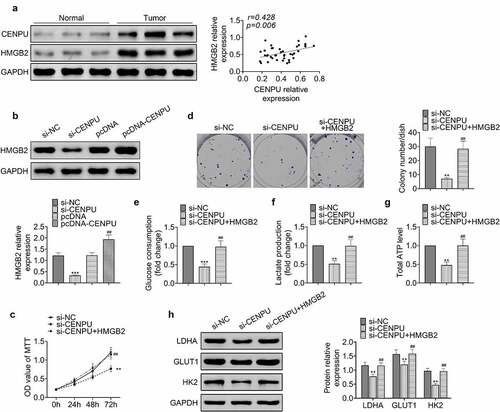
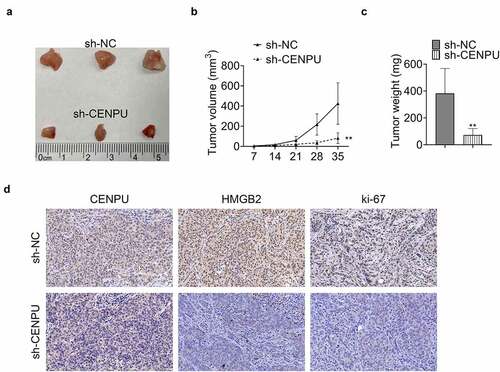
Figure 5. CENPU promoted tumor growth in vivo. (a) Representative image of tumor tissue size from xenograft mouse model. (b) Tumor volume measured on indicated days. **p < 0.01 vs sh-NC, Data are mean ± SEM of tumors from three mice. (c) Tumor weight measured on thirty-fifth day. **p < 0.01 vs sh-NC, Data are mean ± SEM of tumors from five mice. (d) Representative image of IHC assay, which was used to detect the expression levels of CENPU, HMGB2 and ki-67 in tumor tissue