Figures & data
Table 1. Correlation of miR-23a-3p with clinicopathological features
Figure 1. Declined miR-23a-3p is present in GC and connected with poor prognosis. (a). The detection of miR-23a-3p in GC tissues and adjacent normal tissues via RT-qPCR; (b). The detection of miR-23a-3p in GC cell lines (MGC-803, BGC-823, SGC-7901, MKN-45, MKN-7) and gastric mucosa epithelial cells GES-1 via RT-qPCR; (c). The connection of miR-23a-3p with survival prognosis in GC patients; The values were shown as mean ± SD (B, n = 3); Survival prognosis of the two groups was compared via Log-rank (Mantel-Cox) text
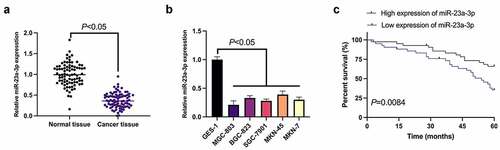
Figure 2. MiR-23a-3p represses GC cell survival and metastasis. (a). The detection of miR-23a-3p via RT-qPCR; (b). The detection of cell proliferation via CCK-8; (c). The detection of cell apoptosis rate via Flow cytometry; (d). The detection of apoptosis-linked proteins Bax and Bcl-2 via Western blot; (e). The detection of cell invasion and migration via Transwell; (f). The detection of EMT-related proteins E-cadherin, N-cadherin and Snail via Western blot; In MGC-803 cells after transfection with miR-23a-3p mimic/inhibitor. The values were shown as mean ± SD (n = 3); Vs the mimic NC, *P < 0.05; Vs the inhibitor NC, ^ P < 0.05
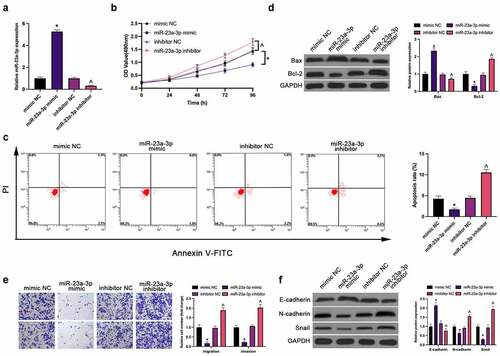
Figure 3. MiR-23a-3p directly targets CCL22. (a). The detection of CCL22 in GC and adjacent normal tissues via RT-qPCR; (b). The detection of CCL22 in GC cell lines (MGC-803, BGC-823, SGC-7901, MKN-45, MKN-7) and gastric mucosa epithelial cells GES-1 via RT-qPCR and Western blot; (c). The detection of CCL22 in MGC-803 cells transfected with miR-23a-3p mimic/inhibitor via RT-qPCR and Western blot; (d). The potential binding sites of miR-23a-3p and CCL22 predicted via TargetScan database (http://www.targetscan.org); (e). The targeting of miR-23a-3p with CCL22 verified via the luciferase report assay; The values were shown as mean ± SD (n = 3); Vs the mimic NC, *P < 0.05; Vs the inhibitor NC, ^ P < 0.05
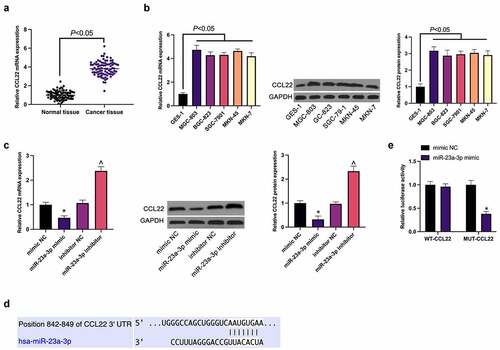
Figure 4. MiR-23a-3p suppresses GC progression via targeting CCL22. (a). The detection of CCL22 via RT-qPCR and Western blot; (b). The detection of cell proliferation via CCK-8; (c). The detection of cell apoptosis rate via Flow cytometry; (d). The detection of Bax and Bcl-2 via Western blot; (e). The detection of cell invasion and migration via Transwell; (f). The detection of EMT-related proteins E-cadherin, N-cadherin and Snail via Western blot; In MGC-803 cells after transfection with miR-23a-3p mimic + pcDNA 3.1-CCL22. The values were shown as mean ± SD (n = 3); Vs the miR-23a-3p mimic + pcDNA 3.1, *P < 0.05
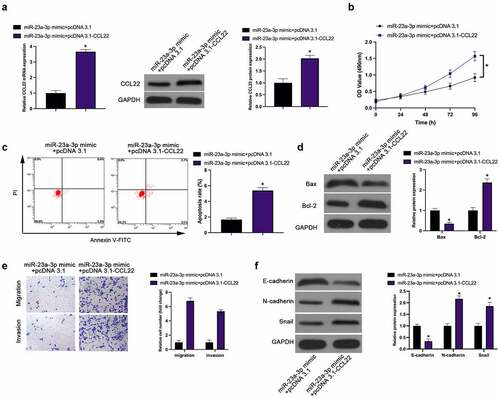
Figure 5. MiR-23a-3p depresses the PI3K/Akt pathway in GC through CCL22. The effect of miR-23a-3p and CCL22 on PI3K/AKT pathway protein phosphorylation in GC detected by Western blot. The values were shown as mean ± SD (n = 3); Vs the mimic NC, *P < 0.05; Vs the inhibitor NC, ^P < 0.05; Vs the miR-23a-3p mimic + si-CCL22, &P < 0.05
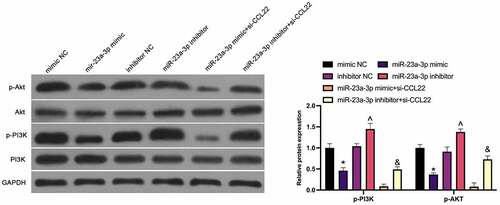
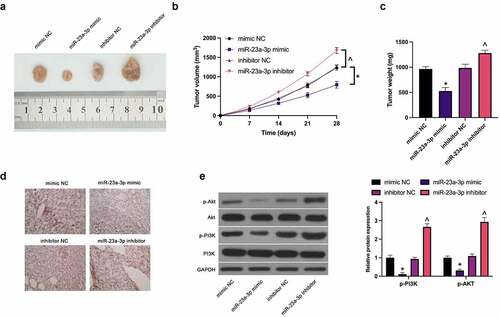
Figure 6. MiR-23a-3p restrains GC cell growth in vivo. (a). Representative pictures of the tumor; (b). The tumor volume; (c). The weight of the tumor; (d). The detection of CCL22 in tumor via immunohistochemistry; (e). The detection of phosphorylation of PI3K/Akt in tumor via Western blot. The values were shown as mean ± SD (n = 3); Vs the mimic NC, *P < 0.05; Vs the inhibitor NC, ^P < 0.05