
Figures & data
Figure 1. The cytotoxicity of celecoxib in human C-28/I2 chondrocytes. Cells were treated with celecoxib at concentrations of 0, 1, 5, 10, 20, 100, 200 μM for 24 hours. (a) The molecular structure of celecoxib; (b) The effects of celecoxib in cell viability of human chondrocytes (*, **, P < 0.05, 0.01 vs. vehicle group)
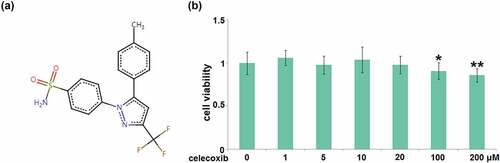
Figure 2. Celecoxib reduced ROS production in TNF-α-challenged human C-28/I2 chondrocytes. Cells were treated with TNF-α (10 ng/ml) in the absence or presence of Celecoxib at concentrations of 10 and 20 μM for 24 hours. ROS generation was labeled by green fluorescence (***, P < 0.005 vs. vehicle group; #, ##, P < 0.05, 0.01 vs. TNF-α group)
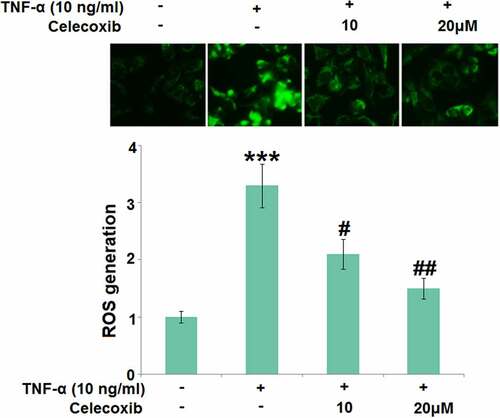
Figure 3. The effect of Celecoxib on the cell cycle arrest in the G0/G1 phase induced by TNF-α in human C-28/I2 chondrocytes. Cells were treated with TNF-α (10 ng/ml) in the absence or presence of Celecoxib at concentrations of 10, 20 μM for 7 days. Cell cycle fraction in the G0/G1 phase, G2/M phase, and S phase was calculated (***, P < 0.005 vs. vehicle group; #, ##, P < 0.05, 0.01 vs. TNF-α group)
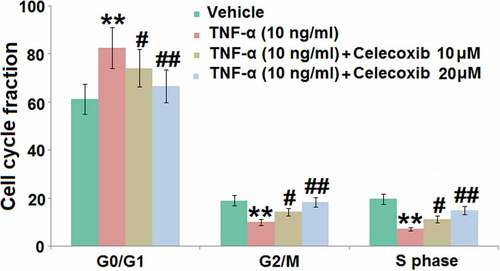
Figure 4. The effect of Celecoxib on the telomerase activity in TNF-α-challenged human C-28/I2 chondrocytes. Cells were treated with TNF-α (10 ng/ml) in the absence or presence of Celecoxib at concentrations of 10, 20 μM for 7 days. The telomerase activity was detected using a chemical kit (***, P < 0.005 vs. vehicle group; #, ##, P < 0.05, 0.01 vs. TNF-α group)
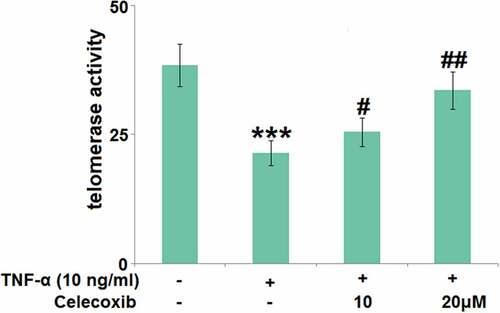
Figure 5. Celecoxib ameliorated cellular senescence against TNF-α in human C-28/I2 chondrocytes. Cells were treated with TNF-α (10 ng/ml) in the absence or presence of Celecoxib at concentrations of 10, 20 μM for 7 days. The SA-β-Gal activity was determined (***, P < 0.005 vs. vehicle group; #, ##, P < 0.05, 0.01 vs. TNF-α group)
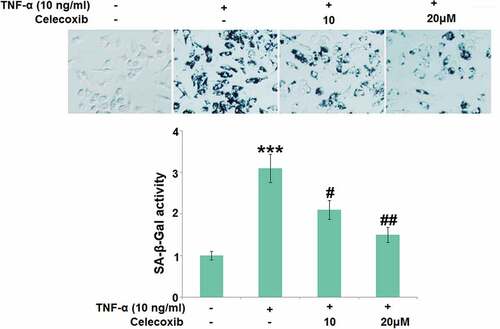
Figure 6. The effect of Celecoxib on the activation of p-ATM and p-CHK2 induced by TNF-α in human chondrocytes. Cells were treated with TNF-α (10 ng/ml) in the absence or presence of Celecoxib at the concentrations of 10, 20 μM for 6 hours. The expressions of p-ATM/ATM and p-CHK2/CHK2 were detected using western blots (***, P < 0.005 vs. vehicle group; #, ##, P < 0.05, 0.01 vs. TNF-α group)
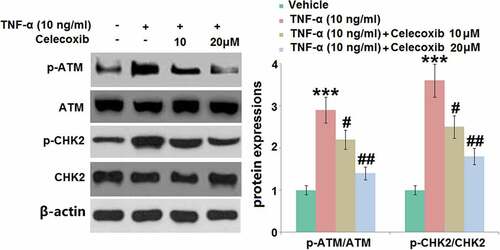
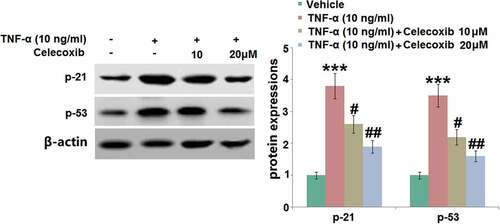
Figure 7. The effect of Celecoxib on the increased expression of p21 and p53induced by TNF-α in human C-28/I2 chondrocytes. Cells were treated with TNF-α (10 ng/ml) in the absence or presence of Celecoxib at concentrations of 10, 20 μM for 6 hours. The expressions of p21 and p53 were detected using western blots (***, P < 0.005 vs. vehicle group; #, ##, P < 0.05, 0.01 vs. TNF-α group)
Data availability statement
Requests for data and materials should be addressed to the corresponding author.