
Figures & data
Figure 1. CRS-induced depression-like behavior in mice. (a) The weight loss of the mice during the CRS for 14 days. (b–d) SPT, TST and FST analysis of the mice in CRS group and control group, respectively. (e) Total distance, the average speed, the central area, central distance and the central enter times between CRS and control group detected by OFT. CRS, chronic restraint stress. Statistical comparisons were performed using the unpaired t test between two groups, n = 8. All data are presented as the mean ± SD; **p < 0.01, CRS group vs control group
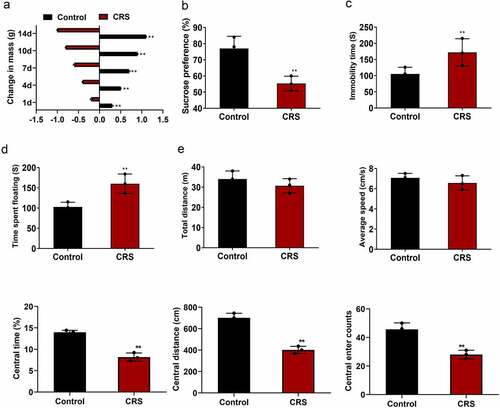
Figure 2. Paeoniflorin attenuated CRS-induced depression-like behavior. (a) Effects of paeoniflorin on the sucrose preference index in mice. (b) Sucrose preference was detected by SPT in CRS group treated with paeoniflorin (10, 30 and 60 mg/kg). (c and d) TST and FST to analyze the immobility time of mice in CRS group treated with paeoniflorin (10, 30 and 60 mg/kg). (e) Total distance, the average speed, the central area, central distance and the central enter times between CRS and control group detected by OFT. CRS, chronic restraint stress. Statistical comparisons were performed using one-way ANOVA to perform comparation more than two groups, n = 8. All data are presented as the mean ± SD; **p < 0.01, *p < 0.05, CRS group vs control group
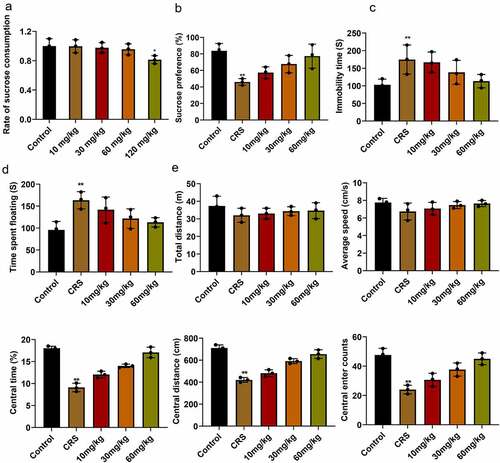
Figure 3. Paeoniflorin attenuated the undesirable morphology and elevated the number of hippocampal neurons in CRS mice. (a) The morphology of hippocampal neurons in hippocampal CA3 area of CRS-induced mice treated with 60 mg/kg paeoniflorin by Nissl staining, Bar = 100 μm. (b) The number of hippocampal neurons in hippocampal CA3 area of CRS-induced mice treated with 60 mg/kg paeoniflorin calculated by Image J. CRS, chronic restraint stress (F = 53.75, n = 8). Statistical comparisons were performed using the unpaired t test between two groups. All data are presented as the mean ± SD; **p < 0.01, CRS group vs control group. ##p < 0.01, Paeoniflorin group vs CRS group
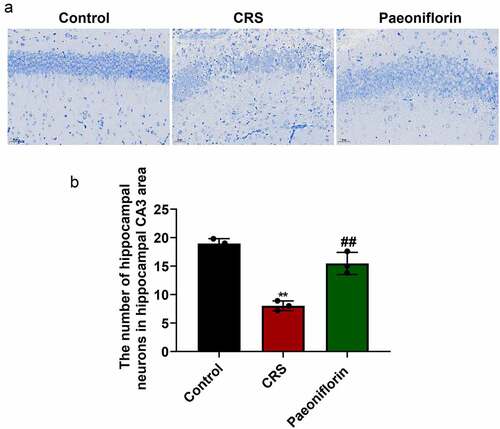
Figure 4. Paeoniflorin attenuated CRS-induced depression-like behavior involved in ERK signaling pathway. (a) The expression of CREB and BDNF detected by qRT-PCR at mRNA level in CRS mice treatment with 60 mg/kg paeoniflorin; GAPDH act as control (F = 129.1; n = 3). (b) The expression of p-ERK1, p-ERK2, CREB and BDNF detected by western blot at protein level in CRS mice treatment with 60 mg/kg paeoniflorin, GAPDH act as control (F = 323.8; n = 3). (c) Immunofluorescence staining was used to detect the expression of p-ERK1, p-ERK2, CREB and BDNF in CRS mice treatment with 60 mg/kg paeoniflorin, DAPI was used to stain the nuclei, Bar = 100 μm. CRS, chronic restraint stress (F = 62.73/10.47; n = 3). Statistical comparisons were performed using one-way ANOVA to perform comparation more than two groups. All data are presented as the mean ± SD; **p < 0.01, CRS group vs control group. ##p < 0.01, Paeoniflorin group vs CRS group
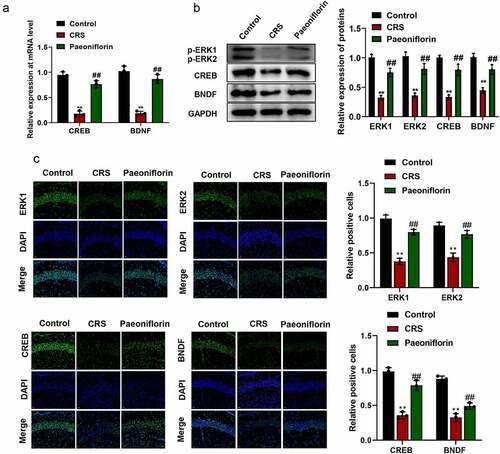
Figure 5. ERK1/2 signaling-related genes was inhibited by ERK1/2 inhibitor U0126. (a) The expression of CREB and BDNF detected by qRT-PCR at mRNA level treated by ERK1/2 inhibitor U0126; GAPDH act as control (F = 98.96; n = 3). (b) The expression of p-ERK1, p-ERK2, CREB and BDNF detected by western blot at protein level treated by ERK1/2 inhibitor U0126, GAPDH act as control (F = 288.5; n = 3). (c) Immunofluorescence staining was used to detect the expression of p-ERK1, p-ERK2, CREB and BDNF treated by ERK1/2 inhibitor U0126, DAPI was used to stain the nuclei, Bar = 100 μm. CRS, chronic restraint stress (F = 105.6/50.15; n = 3). Statistical comparisons were performed using one-way ANOVA to perform comparation more than two groups. All data are presented as the mean ± SD; **p < 0.01, CRS group vs control group. ##p < 0.01, #p < 0.05, U0126 group vs CRS group
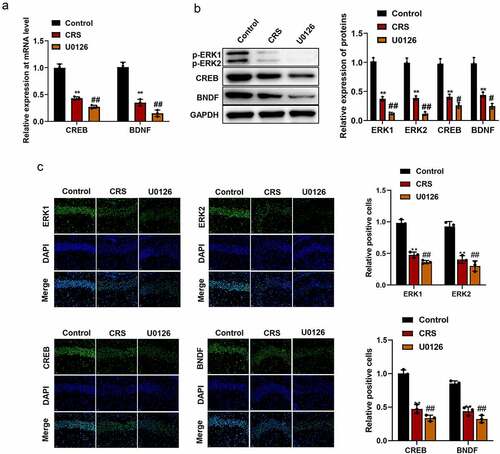
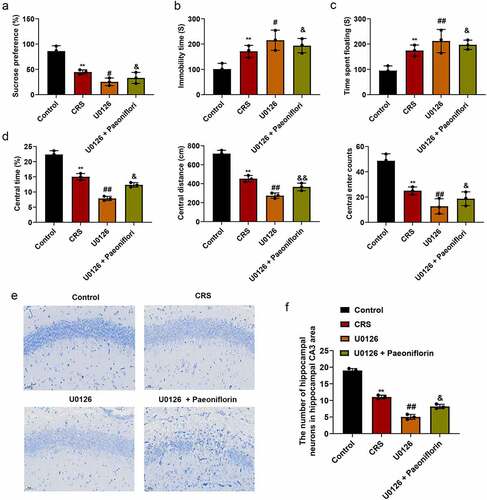
Figure 6. ERK1/2 signaling inhibitor U0126 aggravated depression-like behavior. (a) Sucrose preference detected by SPT when treated with U0126 (F = 28.4; n = 8). (b-c) The immobility time of mice detected by SFT and TST in different groups, respectively (F = 8.473/9.985/115.7/91.24/28.15; n = 8). (d) Total distance, the average speed, the central area, central distance and the central enter times between CRS and control group detected by OFT. (e) The morphology of hippocampal neurons in hippocampal CA3 area of CRS-induced mice treated with U0126 by Nissl staining, Bar = 100 μm. (f) The number of hippocampal neurons in hippocampal CA3 area of CRS-induced mice treated with U0126 calculated by Image J. CRS, chronic restraint stress (F = 257.4; n = 8). Statistical comparisons were performed using one-way ANOVA to perform comparation more than two groups. All data are presented as the mean ± SD; **p < 0.01, CRS group vs control group. ##p < 0.01, #p < 0.05, U0126 group vs CRS group; &&p < 0.01, &p < 0.05, U0126 and paeoniflorin group vs U0126 group
Availability of data and materials
The datasets used and/or analyzed during the current study are available from the corresponding author on reasonable request.