Figures & data
Table 1. Primer sequences for the associated genes which are tested
Figure 1. miR-378b is up-regulated in EtOH-fed mice and EtOH-induced L-02 cells. (a) Representative images of H&E staining of liver sections from control diet (CD)-fed mice (left) or EtOH-fed mice (right). (b) Serum TC levels. (c) Serum TG levels. (d) Liver TC levels. (e) Liver TG levels. (f) Cell TC levels. (g) Cell TG levels. (h) The expression level of miR-378b in liver tissues. (i) The expression level of miR-378b in L-02 cells. All data are expressed as the mean ± SD of at least three separate experiments (n = 3). *p < 0.05 vs. control; **p < 0.01 vs. control
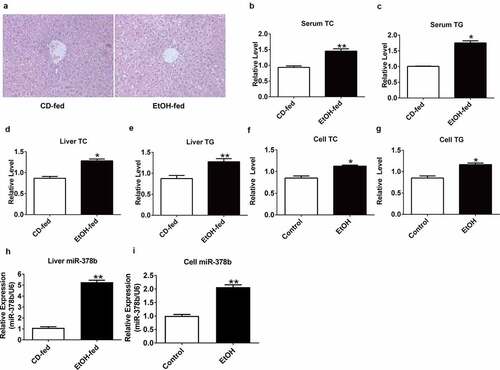
Figure 2. miR-378b directly targets CaMKK2. (a) Predicted duplex formation between miR-378b and human wild-type/mutant CaMKK2-3ʹ-UTR. (b) Luciferase reporter assay for the interaction between wild-type 3ʹ-UTR of CaMKK2, as well as mutant 3ʹ-UTR of CaMKK2 in the 293 T cells. (c-d) mRNA expression levels of CaMKK2 in L-02 cells. (e-f) Western blot analysis for protein expression of CaMKK2 in L-02 cells. All data were expressed as the mean ± SD of at least three separate experiments.*p < 0.05,**p < 0.01 vs. control
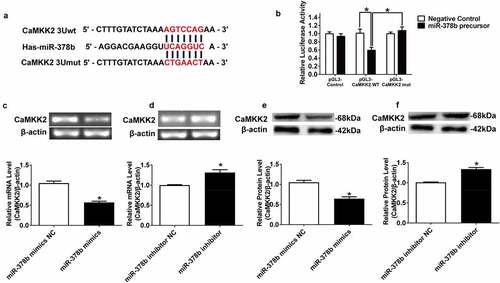
Figure 3. miR-378b over-expression disturbs lipid metabolism in L-02 cells. (a) The TC level in L-02 cells. (b) The TG level in L-02 cells. (c) The expression level of miR-378b in L-02 cells. (d) mRNA expression levels of CaMKK2 in L-02 cells. (e) Western blot analysis for protein expression of CaMKK2 and p-AMPK/AMPK. (f) mRNA expression levels and protein expression levels for PPARα and CPT1. (g) mRNA expression levels and protein expression levels for FASN and SREBP1c. (h) Western blot analysis for protein expression of p-ACC/ACC. All data are expressed as the mean ± SD of at least three separate experiments. *p < 0.05, **p < 0.01 vs. control. #p < 0.05, ##p < 0.01 vs. miR-378b-mimics NC
Figure 3. Continued
Figure 4. Suppression of miR-378b improved lipid metabolism in L-02 cells. (a) The TC levels in L-02 cells. (b) The TG levels in L-02 cells. (c) The expression level of miR-378b in L-02 cells. (d) The mRNA expression level of CaMKK2 in L-02 cells. (e) Western blot analysis of the protein expression of CaMKK2 and p-AMPK/AMPK protein ratio. (f) The mRNA and protein expression levels of PPARα and CPT1. (g) The mRNA and protein expression levels of FASN and SREBP1c. (h) Western blot analysis of the p-ACC/ACC protein ratio. All data are expressed as the mean ± SD of at least three separate experiments. *p < 0.05, **p < 0.01 vs. control. #p < 0.05, ##p < 0.01 vs. miR-378b-inhibitor NC
Figure 4. Continued
Figure 5. miR-378b over-expression aggravates lipid accumulation in vivo. (a) Representative images of H&E staining of liver sections. (b) Serum TC levels. (c) Serum TG levels. (d) Liver TC levels. (e) Liver TG levels. (f) The expression of miR-378b in liver tissue. (g) mRNA expression levels of CaMKK2 in liver tissue. (h) Western blot analysis for protein expression of CaMKK2 and p-AMPK/AMPK in liver tissue. (i) mRNA expression levels and protein expression levels for PPARα and CPT1 in liver tissue. (j) mRNA expression levels and protein expression levels for FASN and SREBP1c in liver tissue. (k) Western blot analysis for protein expression of p-ACC/ACC in liver tissue. All data were expressed as the mean ± SD of at least three separate experiments (n = 3). *p < 0.05, **p < 0.01 compared with the CD-fed group. #p < 0.05, ##p < 0.01 compared with the AAV-miR-378b-up NC group
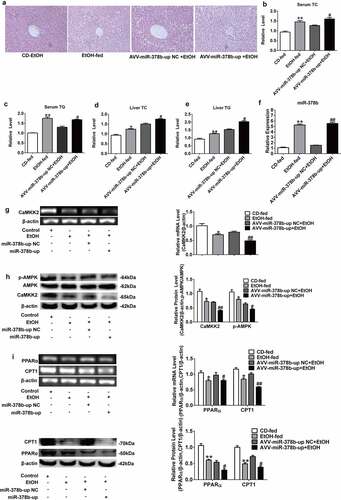
Figure 5. Continued
Figure 6. miR-378b inhibition amoliorates lipid lipid dysfunction in vivo. (a) Representative images of H&E staining of liver sections. (b) Serum TC levels. (c) Serum TG levels. (d) Liver TC levels. (e) Liver TG levels. (f) The expression of miR-378b in liver tissue. (g) mRNA expression levels of CaMKK2 in liver tissue. (h) Western blot analysis for protein expression of CaMKK2 and p-AMPK/AMPK in liver tissue. (i) mRNA expression levels and protein expression levels for PPARα and CPT1 in liver tissue. (j) mRNA expression levels and protein expression levels for FASN and SREBP1c in liver tissue. (k) Western blot analysis for protein expression of p-ACC/ACC in liver tissue. All data were expressed as the mean ± SD of at least three separate experiments (n = 3). *p < 0.05, **p < 0.01 compared with the CD-fed group. #p < 0.05, ##p < 0.01 compared with the AAV-miR-378b-down NC group
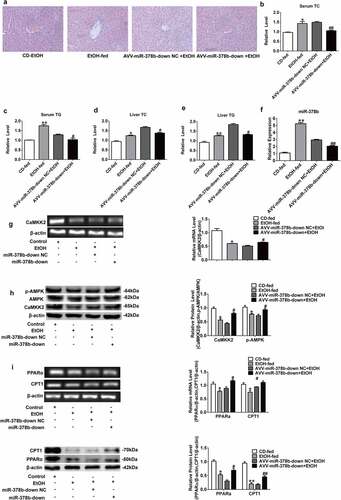
Figure 6. Continued
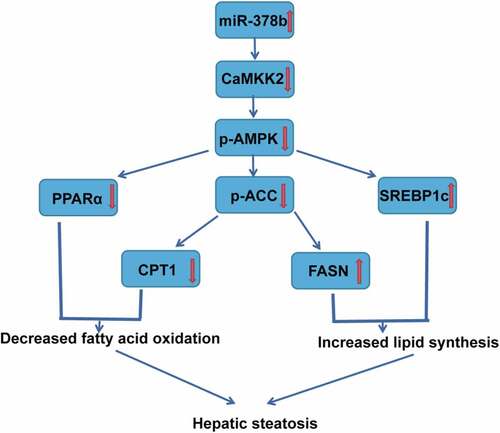
Figure 7. Summary of the mechanism by which miR-378b targets CaMKK2 to regulate hepatic steatosis through the AMPK cascade. First, the increased expression of miR-378b induced by EtOH decreases the expression of CaMKK2, after which the AMPK cascade is inhibited, eventually aggravating steatosis