
Figures & data
Table 1. Top 5 most significantly differentially expressed lncRNA, mRNA and miRNA
Figure 1. Differentially expressed RNAs in HNSCC. (a) Volcano plots of differentially expressed mRNAs (DEGs), lncRNAs (DELs) and miRNAs (DEMs) based on TCGA database. X axis represented the mean expression differences of mRNAs, lncRNAs and miRNAs between HNSCC tissues and paracancerous normal tissues, and Y axis represented log transformed false discovery rate (FDR). Red dots represented upregulated RNAs, green represented downregulated RNAs, and black represented no significant difference. The top 5 most significantly differentially expressed DEGs, DELs and DEMs were annotated in the corresponding plots. (b) Clustering heatmaps based on the expressions of DEGs, DELs and DEMs between HNSCC tissues and paracancerous normal tissues. The right vertical axis represented differentially expressed RNAs, the left vertical axis represented the sample clusters, and the bottom horizontal axis showed the TCGA sample IDs. The color scales on the upper left showed the expression values. Red color represented upregulated RNAs and green represented downregulated RNAs. DEG, differentially expressed mRNA. DEL, differentially expressed lncRNA. DEM, differentially expressed miRNA. HNSCC, head and neck squamous cell carcinoma
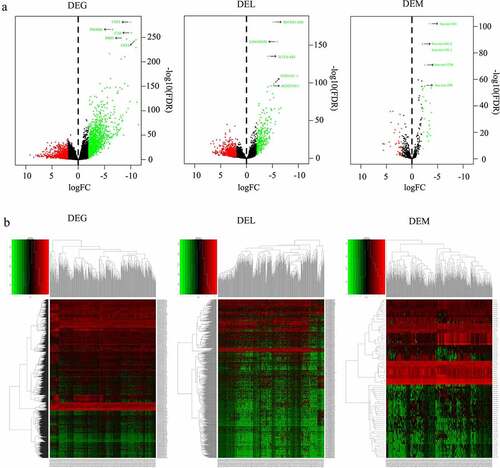
Figure 2. Scatter plot of the expression of lncRNA ZNF710-AS1 and mRNA GDP1L in HNSCC and normal tissues. The lncRNA-mRNA exhibited similar expression pattern in HNSCC tissues and non-HNSCC normal tissues and showed the strongest correlation in the Pearson correlation analysis of all the 1998 DEGs, 80 DEMs, 1019 DELs
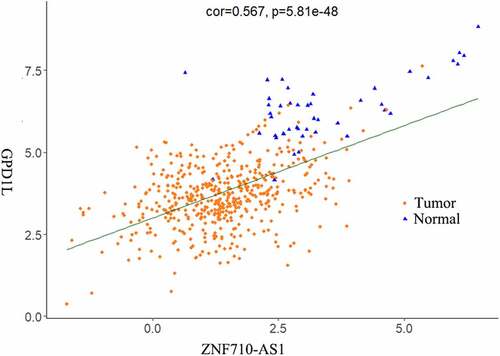
Figure 3. Functional analysis of the 1998 significantly differentially expressed mRNAs in HNSCC. (a-c) Top 10 most significantly enriched BP (a), CC (b), MF (c) terms of the differentially expressed mRNAs analyzed by GO enrichment analysis (p < 0.01). (d) Top 10 most significantly enriched KEGG pathways of the differentially expressed mRNAs (p < 0.01). BP, biological processes. CC, cellular components. MF, molecular functions. GO, gene ontology. KEGG, Kyoto Encyclopedia of Genes and Genomes
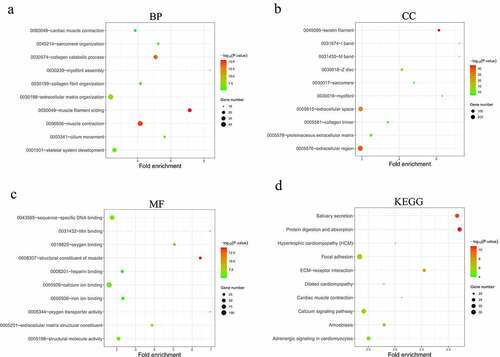
Table 2. The top 10 hub RNAs in the ceRNA network ranked by MCC scores
Figure 4. Construction of the lncRNA-miRNA-mRNA interactive ceRNA networks. (a) ceRNA network in HNSCC. A total of 164 genes including 90 DEGs, 67 DELs and 7 DEMs were used to construct the ceRNA network. (b) A ceRNA subnetwork was constructed with the top 10 hub genes showing the highest MCC scores. Green, blue and red nodes represented DEGs, DELs and DEMs, respectively. An edge in the networks represented the interactive relationship between two genes. MCC, Maximal Clique Centrality. (c) The expression of lncRNA PART1 and LINC00520 in HNSCC and normal tissues (p < 0.01)
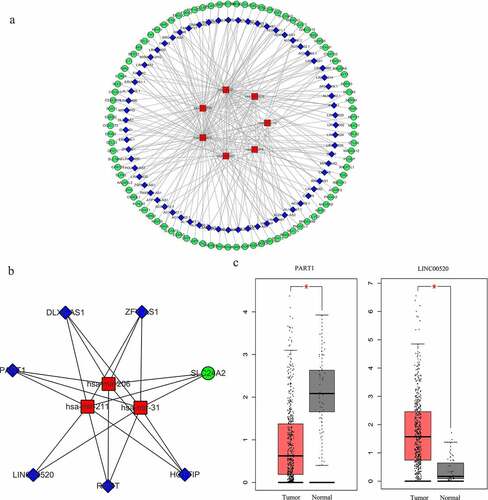
Figure 5. Functional analysis of the 90 significantly differentially expressed mRNAs from the constructed ceRNA network. (a-c) Top 10 most significantly enriched BP (a), CC (b), MF (c) terms of the differentially expressed mRNAs analyzed by GO (p < 0.01). (d) Top 10 most significantly enriched KEGG pathways of the differentially expressed mRNAs (p < 0.01). BP, biological processes. CC, cellular components. MF, molecular functions. GO, gene ontology. KEGG, Kyoto Encyclopedia of Genes and Genomes
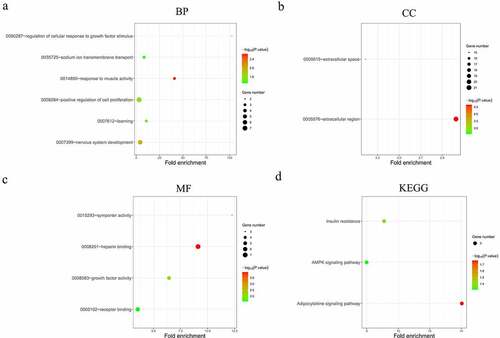
Table 3. Differentially expressed lncRNAs that were highly correlated with HNSCC and patient survival
Figure 6. Construction of a lncRNA co-expression network using WGCNA. (a) Cluster dendrogram of the co-expression network for the top 60% variance lncRNAs based on topological overlap. (b) Analysis of the correlations of co-expression modules with clinical traits. The background color of each cell represented the strength of correlation between the gene module and the clinical traits. Each cell contains two values: the value above is the Pearson’s correlation coefficient and the value in parentheses below is the P-value. (c) Scatter diagram for the correlation between module membership and gene significance for survival in the brown module. (d) Heatmap plot of the adjacencies in the gene co-expression network
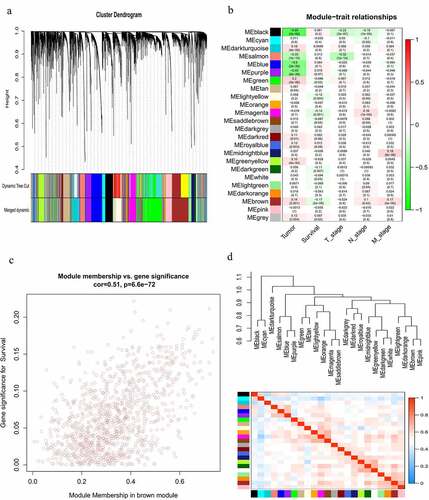
Figure 7. Kaplan-Meier survival analysis and the expression profiles of the 5 survival-associated lncRNAs. (a) Kaplan-Meier survival curves of the 5 survival-associated lncRNAs. X axis represented the overall survival time in months. Y axis represented the survival probability. The logrank test was used to compare the survival time between the low- and high-expression groups (p < 0.05). (b) Expression levels of survival-related lncRNAs in HNSCC tissues and non-HNSCC normal tissues (p < 0.01)
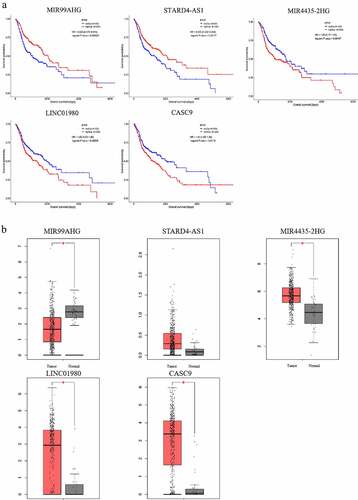
Figure 8. Verification of expression patterns of lncRNA PART1, MIR4435-2H and LINC01980 in HNSCC. (a) Total RNA extracted from NP69 (immortalized nasopharyngeal epithelial cell line), C666-1 (nasopharyngeal carcinoma cell line), CNE-2 (nasopharyngeal carcinoma cell line), HOK (human oral keratinocytes) and SCC-2 (OSCC cell line) was subjected to RT-qPCR assays to determine the expression levels of PART1, MIR4435-2H and LINC01980. (b) Total RNA extracted from the serum of normal individuals and HNSCC patients was subjected to RT-qPCR assays to determine the expression levels of PART1, MIR4435-2H and LINC01980. *p < 0.05
Supplemental Material
Download MS Excel (19.5 KB)Data availability statement
The data that support the findings of this study are available from the corresponding author upon reasonable request.